Cape Verdean vs Bulgarian Currently Married
COMPARE
Cape Verdean
Bulgarian
Currently Married
Currently Married Comparison
Cape Verdeans
Bulgarians
39.6%
CURRENTLY MARRIED
0.0/ 100
METRIC RATING
338th/ 347
METRIC RANK
49.1%
CURRENTLY MARRIED
99.7/ 100
METRIC RATING
22nd/ 347
METRIC RANK
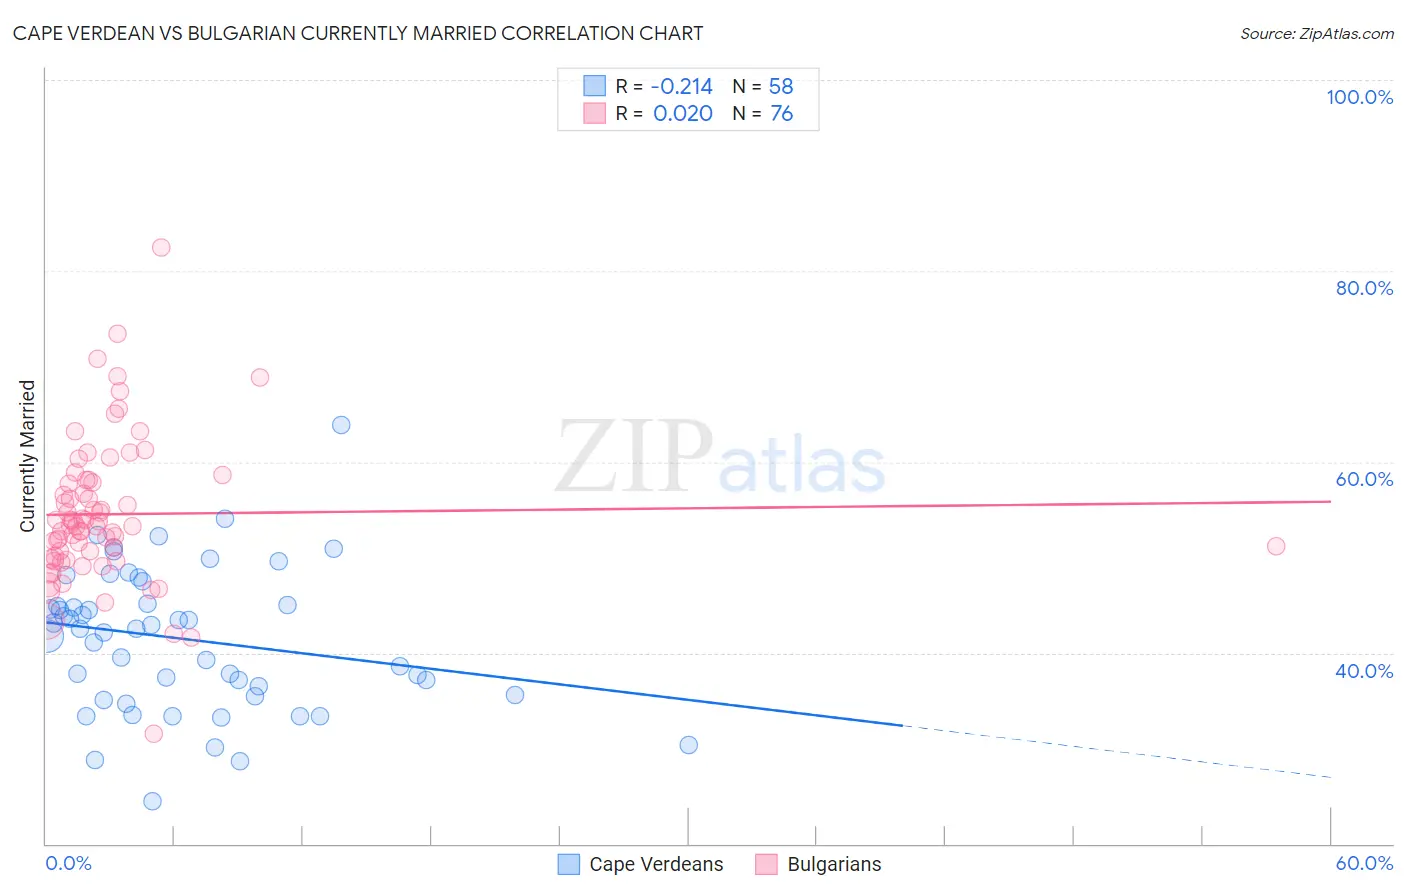
Cape Verdean vs Bulgarian Currently Married Correlation Chart
The statistical analysis conducted on geographies consisting of 107,578,938 people shows a weak negative correlation between the proportion of Cape Verdeans and percentage of population currently married in the United States with a correlation coefficient (R) of -0.214 and weighted average of 39.6%. Similarly, the statistical analysis conducted on geographies consisting of 205,615,003 people shows no correlation between the proportion of Bulgarians and percentage of population currently married in the United States with a correlation coefficient (R) of 0.020 and weighted average of 49.1%, a difference of 24.1%.
Currently Married Correlation Summary
| Measurement | Cape Verdean | Bulgarian |
| Minimum | 24.4% | 31.5% |
| Maximum | 63.9% | 82.5% |
| Range | 39.5% | 51.0% |
| Mean | 41.5% | 54.5% |
| Median | 42.5% | 53.3% |
| Interquartile 25% (IQ1) | 35.6% | 49.9% |
| Interquartile 75% (IQ3) | 45.1% | 58.0% |
| Interquartile Range (IQR) | 9.5% | 8.1% |
| Standard Deviation (Sample) | 7.5% | 7.7% |
| Standard Deviation (Population) | 7.4% | 7.6% |
Similar Demographics by Currently Married
Demographics Similar to Cape Verdeans by Currently Married
In terms of currently married, the demographic groups most similar to Cape Verdeans are Black/African American (39.6%, a difference of 0.090%), Dominican (39.5%, a difference of 0.15%), British West Indian (39.8%, a difference of 0.47%), Lumbee (39.8%, a difference of 0.65%), and Puerto Rican (39.9%, a difference of 0.81%).
| Demographics | Rating | Rank | Currently Married |
| Immigrants | Barbados | 0.0 /100 | #331 | Tragic 40.3% |
| Immigrants | St. Vincent and the Grenadines | 0.0 /100 | #332 | Tragic 40.1% |
| Yup'ik | 0.0 /100 | #333 | Tragic 39.9% |
| Puerto Ricans | 0.0 /100 | #334 | Tragic 39.9% |
| Lumbee | 0.0 /100 | #335 | Tragic 39.8% |
| British West Indians | 0.0 /100 | #336 | Tragic 39.8% |
| Blacks/African Americans | 0.0 /100 | #337 | Tragic 39.6% |
| Cape Verdeans | 0.0 /100 | #338 | Tragic 39.6% |
| Dominicans | 0.0 /100 | #339 | Tragic 39.5% |
| Immigrants | Grenada | 0.0 /100 | #340 | Tragic 39.1% |
| Navajo | 0.0 /100 | #341 | Tragic 39.0% |
| Immigrants | Dominican Republic | 0.0 /100 | #342 | Tragic 38.9% |
| Pueblo | 0.0 /100 | #343 | Tragic 38.2% |
| Immigrants | Cabo Verde | 0.0 /100 | #344 | Tragic 37.8% |
| Tohono O'odham | 0.0 /100 | #345 | Tragic 36.8% |
Demographics Similar to Bulgarians by Currently Married
In terms of currently married, the demographic groups most similar to Bulgarians are Immigrants from Pakistan (49.1%, a difference of 0.11%), Scottish (49.2%, a difference of 0.22%), Lithuanian (49.0%, a difference of 0.22%), Maltese (49.0%, a difference of 0.23%), and Immigrants from Korea (49.0%, a difference of 0.28%).
| Demographics | Rating | Rank | Currently Married |
| Pennsylvania Germans | 99.9 /100 | #15 | Exceptional 49.6% |
| Chinese | 99.9 /100 | #16 | Exceptional 49.5% |
| Scandinavians | 99.9 /100 | #17 | Exceptional 49.5% |
| Immigrants | Scotland | 99.8 /100 | #18 | Exceptional 49.3% |
| Europeans | 99.8 /100 | #19 | Exceptional 49.3% |
| Luxembourgers | 99.8 /100 | #20 | Exceptional 49.3% |
| Scottish | 99.8 /100 | #21 | Exceptional 49.2% |
| Bulgarians | 99.7 /100 | #22 | Exceptional 49.1% |
| Immigrants | Pakistan | 99.7 /100 | #23 | Exceptional 49.1% |
| Lithuanians | 99.6 /100 | #24 | Exceptional 49.0% |
| Maltese | 99.6 /100 | #25 | Exceptional 49.0% |
| Immigrants | Korea | 99.6 /100 | #26 | Exceptional 49.0% |
| Burmese | 99.6 /100 | #27 | Exceptional 48.9% |
| Welsh | 99.5 /100 | #28 | Exceptional 48.9% |
| Croatians | 99.5 /100 | #29 | Exceptional 48.9% |