Canadian vs Somali Divorced or Separated
COMPARE
Canadian
Somali
Divorced or Separated
Divorced or Separated Comparison
Canadians
Somalis
12.4%
DIVORCED OR SEPARATED
5.3/ 100
METRIC RATING
232nd/ 347
METRIC RANK
12.6%
DIVORCED OR SEPARATED
0.9/ 100
METRIC RATING
253rd/ 347
METRIC RANK
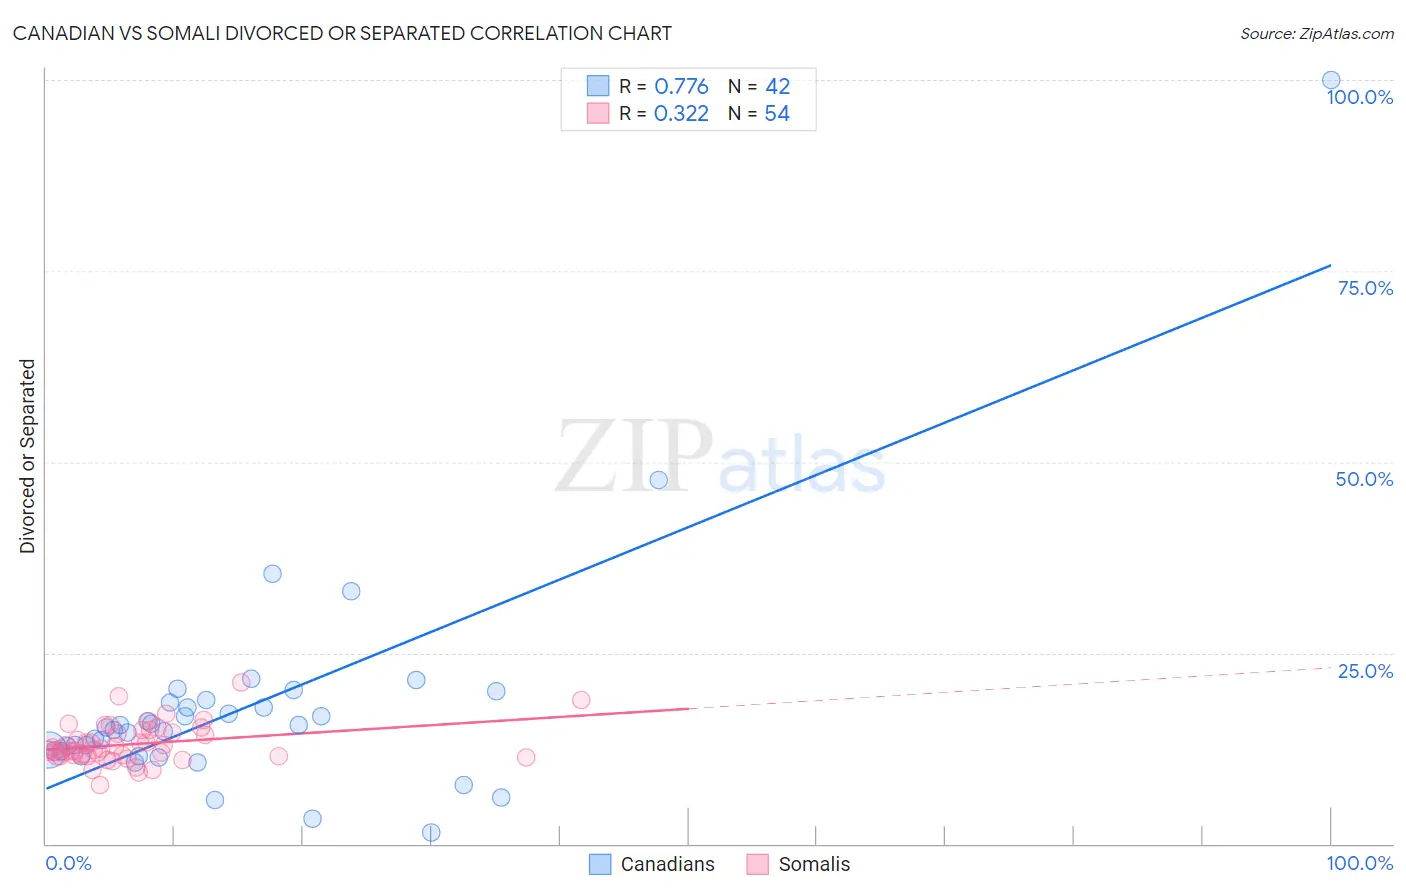
Canadian vs Somali Divorced or Separated Correlation Chart
The statistical analysis conducted on geographies consisting of 437,381,276 people shows a strong positive correlation between the proportion of Canadians and percentage of population currently divorced or separated in the United States with a correlation coefficient (R) of 0.776 and weighted average of 12.4%. Similarly, the statistical analysis conducted on geographies consisting of 99,313,071 people shows a mild positive correlation between the proportion of Somalis and percentage of population currently divorced or separated in the United States with a correlation coefficient (R) of 0.322 and weighted average of 12.6%, a difference of 1.6%.
Divorced or Separated Correlation Summary
| Measurement | Canadian | Somali |
| Minimum | 1.4% | 7.7% |
| Maximum | 100.0% | 21.1% |
| Range | 98.6% | 13.4% |
| Mean | 17.8% | 13.0% |
| Median | 15.1% | 12.4% |
| Interquartile 25% (IQ1) | 12.1% | 11.5% |
| Interquartile 75% (IQ3) | 18.4% | 14.6% |
| Interquartile Range (IQR) | 6.3% | 3.1% |
| Standard Deviation (Sample) | 15.3% | 2.5% |
| Standard Deviation (Population) | 15.1% | 2.5% |
Similar Demographics by Divorced or Separated
Demographics Similar to Canadians by Divorced or Separated
In terms of divorced or separated, the demographic groups most similar to Canadians are Malaysian (12.4%, a difference of 0.090%), West Indian (12.4%, a difference of 0.17%), Yugoslavian (12.3%, a difference of 0.19%), Immigrants from Bosnia and Herzegovina (12.4%, a difference of 0.19%), and Colombian (12.4%, a difference of 0.21%).
| Demographics | Rating | Rank | Divorced or Separated |
| Belgians | 9.7 /100 | #225 | Tragic 12.3% |
| Immigrants | Western Africa | 9.3 /100 | #226 | Tragic 12.3% |
| Hmong | 8.8 /100 | #227 | Tragic 12.3% |
| Immigrants | Cameroon | 8.3 /100 | #228 | Tragic 12.3% |
| Immigrants | Sudan | 8.2 /100 | #229 | Tragic 12.3% |
| Yakama | 7.8 /100 | #230 | Tragic 12.3% |
| Yugoslavians | 6.6 /100 | #231 | Tragic 12.3% |
| Canadians | 5.3 /100 | #232 | Tragic 12.4% |
| Malaysians | 4.8 /100 | #233 | Tragic 12.4% |
| West Indians | 4.4 /100 | #234 | Tragic 12.4% |
| Immigrants | Bosnia and Herzegovina | 4.3 /100 | #235 | Tragic 12.4% |
| Colombians | 4.2 /100 | #236 | Tragic 12.4% |
| Immigrants | Laos | 4.2 /100 | #237 | Tragic 12.4% |
| Sudanese | 4.0 /100 | #238 | Tragic 12.4% |
| Immigrants | Germany | 4.0 /100 | #239 | Tragic 12.4% |
Demographics Similar to Somalis by Divorced or Separated
In terms of divorced or separated, the demographic groups most similar to Somalis are Liberian (12.6%, a difference of 0.0%), Senegalese (12.6%, a difference of 0.060%), Welsh (12.6%, a difference of 0.16%), Immigrants from Colombia (12.6%, a difference of 0.31%), and Irish (12.5%, a difference of 0.33%).
| Demographics | Rating | Rank | Divorced or Separated |
| Immigrants | West Indies | 1.9 /100 | #246 | Tragic 12.5% |
| Germans | 1.8 /100 | #247 | Tragic 12.5% |
| Nepalese | 1.8 /100 | #248 | Tragic 12.5% |
| Finns | 1.8 /100 | #249 | Tragic 12.5% |
| Irish | 1.3 /100 | #250 | Tragic 12.5% |
| Aleuts | 1.3 /100 | #251 | Tragic 12.5% |
| Liberians | 0.9 /100 | #252 | Tragic 12.6% |
| Somalis | 0.9 /100 | #253 | Tragic 12.6% |
| Senegalese | 0.8 /100 | #254 | Tragic 12.6% |
| Welsh | 0.7 /100 | #255 | Tragic 12.6% |
| Immigrants | Colombia | 0.6 /100 | #256 | Tragic 12.6% |
| Immigrants | Somalia | 0.6 /100 | #257 | Tragic 12.6% |
| Indonesians | 0.6 /100 | #258 | Tragic 12.6% |
| Yuman | 0.6 /100 | #259 | Tragic 12.6% |
| Immigrants | Uruguay | 0.6 /100 | #260 | Tragic 12.6% |