Canadian vs Kenyan Receiving Food Stamps
COMPARE
Canadian
Kenyan
Receiving Food Stamps
Receiving Food Stamps Comparison
Canadians
Kenyans
10.5%
RECEIVING FOOD STAMPS
94.8/ 100
METRIC RATING
116th/ 347
METRIC RANK
11.6%
RECEIVING FOOD STAMPS
60.2/ 100
METRIC RATING
167th/ 347
METRIC RANK
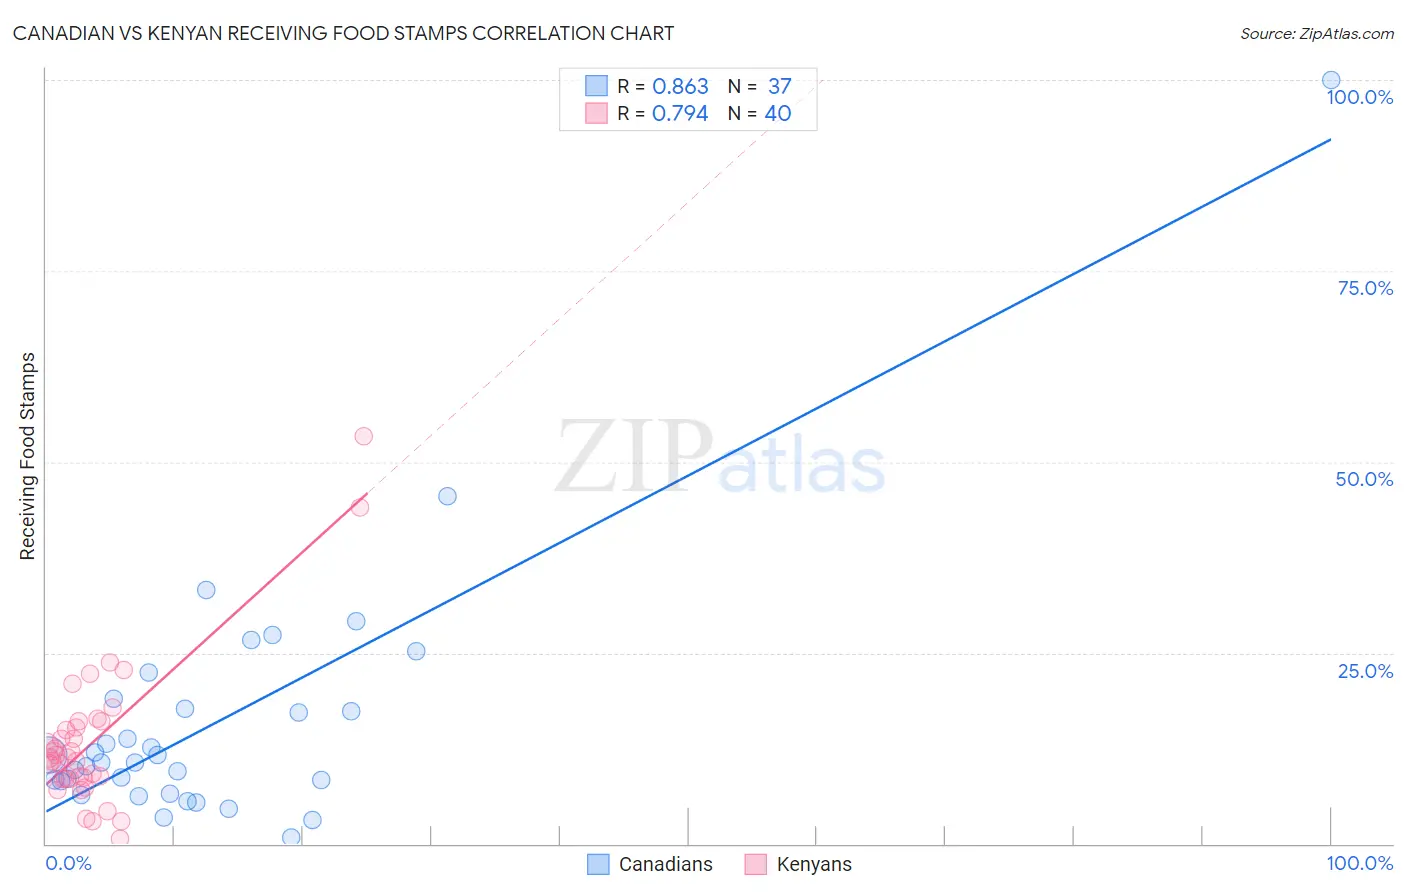
Canadian vs Kenyan Receiving Food Stamps Correlation Chart
The statistical analysis conducted on geographies consisting of 436,119,320 people shows a very strong positive correlation between the proportion of Canadians and percentage of population receiving government assistance and/or food stamps in the United States with a correlation coefficient (R) of 0.863 and weighted average of 10.5%. Similarly, the statistical analysis conducted on geographies consisting of 168,088,158 people shows a strong positive correlation between the proportion of Kenyans and percentage of population receiving government assistance and/or food stamps in the United States with a correlation coefficient (R) of 0.794 and weighted average of 11.6%, a difference of 9.7%.
Receiving Food Stamps Correlation Summary
| Measurement | Canadian | Kenyan |
| Minimum | 0.80% | 0.60% |
| Maximum | 100.0% | 53.3% |
| Range | 99.2% | 52.7% |
| Mean | 15.9% | 13.3% |
| Median | 10.7% | 11.2% |
| Interquartile 25% (IQ1) | 7.4% | 8.5% |
| Interquartile 75% (IQ3) | 18.4% | 15.6% |
| Interquartile Range (IQR) | 11.0% | 7.2% |
| Standard Deviation (Sample) | 17.1% | 9.9% |
| Standard Deviation (Population) | 16.9% | 9.7% |
Similar Demographics by Receiving Food Stamps
Demographics Similar to Canadians by Receiving Food Stamps
In terms of receiving food stamps, the demographic groups most similar to Canadians are Immigrants from Saudi Arabia (10.5%, a difference of 0.050%), Immigrants from Nepal (10.6%, a difference of 0.16%), Scotch-Irish (10.5%, a difference of 0.22%), Assyrian/Chaldean/Syriac (10.6%, a difference of 0.50%), and Icelander (10.5%, a difference of 0.52%).
| Demographics | Rating | Rank | Receiving Food Stamps |
| Immigrants | Pakistan | 96.2 /100 | #109 | Exceptional 10.4% |
| Pakistanis | 95.9 /100 | #110 | Exceptional 10.4% |
| Romanians | 95.8 /100 | #111 | Exceptional 10.4% |
| Mongolians | 95.8 /100 | #112 | Exceptional 10.5% |
| Icelanders | 95.4 /100 | #113 | Exceptional 10.5% |
| Scotch-Irish | 95.1 /100 | #114 | Exceptional 10.5% |
| Immigrants | Saudi Arabia | 94.9 /100 | #115 | Exceptional 10.5% |
| Canadians | 94.8 /100 | #116 | Exceptional 10.5% |
| Immigrants | Nepal | 94.6 /100 | #117 | Exceptional 10.6% |
| Assyrians/Chaldeans/Syriacs | 94.1 /100 | #118 | Exceptional 10.6% |
| Immigrants | Poland | 93.9 /100 | #119 | Exceptional 10.6% |
| Ethiopians | 93.9 /100 | #120 | Exceptional 10.6% |
| Slavs | 93.8 /100 | #121 | Exceptional 10.6% |
| Sri Lankans | 93.7 /100 | #122 | Exceptional 10.6% |
| Immigrants | Philippines | 93.3 /100 | #123 | Exceptional 10.7% |
Demographics Similar to Kenyans by Receiving Food Stamps
In terms of receiving food stamps, the demographic groups most similar to Kenyans are Tlingit-Haida (11.6%, a difference of 0.16%), Immigrants from Eastern Africa (11.6%, a difference of 0.28%), Costa Rican (11.6%, a difference of 0.35%), Immigrants from Belarus (11.5%, a difference of 0.38%), and Immigrants from Western Asia (11.6%, a difference of 0.56%).
| Demographics | Rating | Rank | Receiving Food Stamps |
| French Canadians | 69.5 /100 | #160 | Good 11.4% |
| Pennsylvania Germans | 68.4 /100 | #161 | Good 11.4% |
| Alsatians | 68.0 /100 | #162 | Good 11.4% |
| Immigrants | Southern Europe | 65.8 /100 | #163 | Good 11.5% |
| Immigrants | Chile | 65.0 /100 | #164 | Good 11.5% |
| Arabs | 64.7 /100 | #165 | Good 11.5% |
| Immigrants | Belarus | 62.8 /100 | #166 | Good 11.5% |
| Kenyans | 60.2 /100 | #167 | Good 11.6% |
| Tlingit-Haida | 59.1 /100 | #168 | Average 11.6% |
| Immigrants | Eastern Africa | 58.3 /100 | #169 | Average 11.6% |
| Costa Ricans | 57.9 /100 | #170 | Average 11.6% |
| Immigrants | Western Asia | 56.4 /100 | #171 | Average 11.6% |
| Guamanians/Chamorros | 54.2 /100 | #172 | Average 11.7% |
| Immigrants | Syria | 53.4 /100 | #173 | Average 11.7% |
| Immigrants | Eritrea | 50.0 /100 | #174 | Average 11.7% |