Canadian vs Immigrants from Kazakhstan Divorced or Separated
COMPARE
Canadian
Immigrants from Kazakhstan
Divorced or Separated
Divorced or Separated Comparison
Canadians
Immigrants from Kazakhstan
12.4%
DIVORCED OR SEPARATED
5.3/ 100
METRIC RATING
232nd/ 347
METRIC RANK
11.7%
DIVORCED OR SEPARATED
97.8/ 100
METRIC RATING
106th/ 347
METRIC RANK
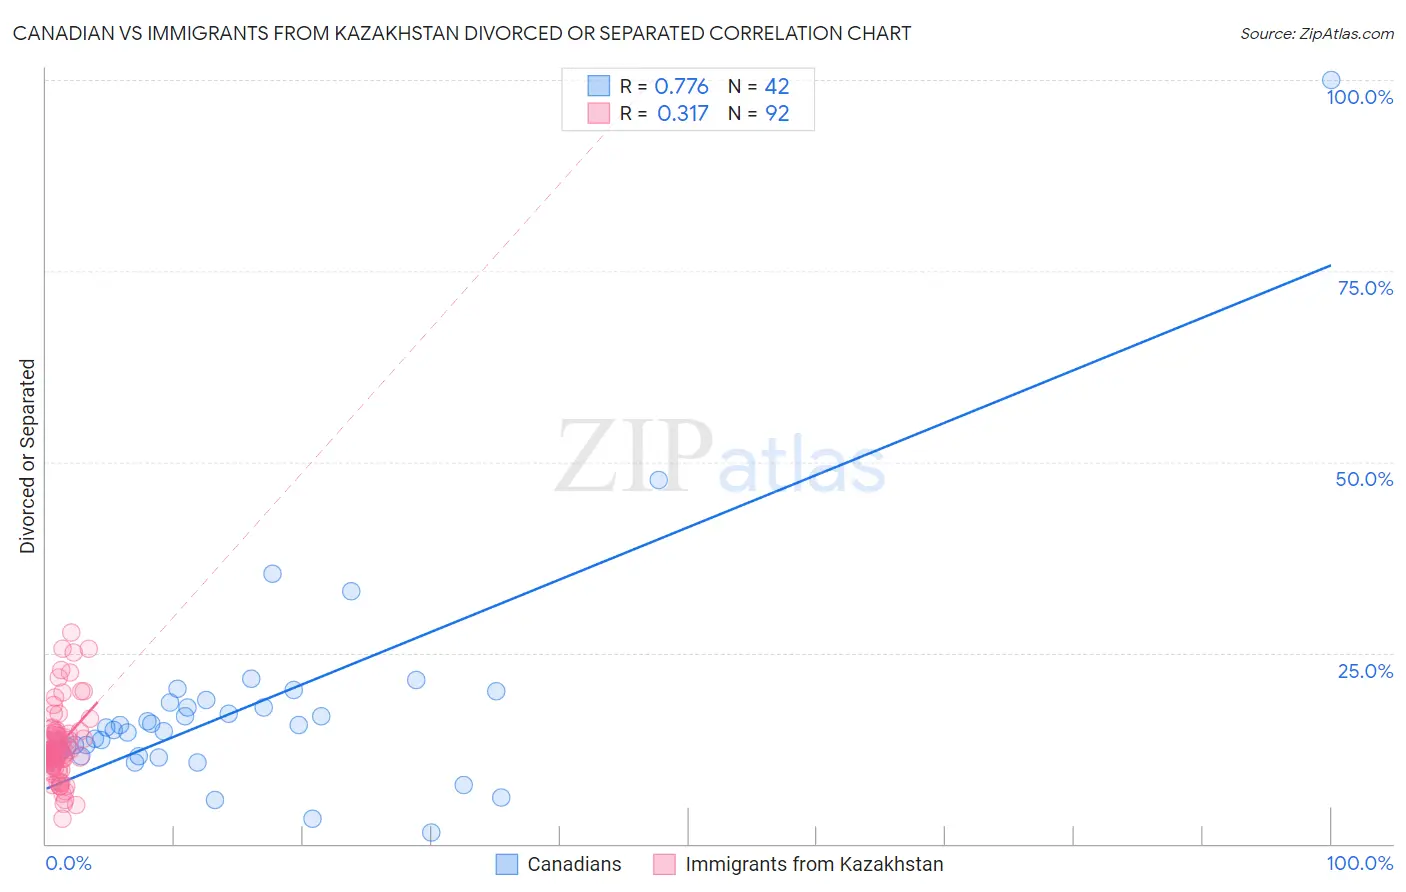
Canadian vs Immigrants from Kazakhstan Divorced or Separated Correlation Chart
The statistical analysis conducted on geographies consisting of 437,381,276 people shows a strong positive correlation between the proportion of Canadians and percentage of population currently divorced or separated in the United States with a correlation coefficient (R) of 0.776 and weighted average of 12.4%. Similarly, the statistical analysis conducted on geographies consisting of 124,441,918 people shows a mild positive correlation between the proportion of Immigrants from Kazakhstan and percentage of population currently divorced or separated in the United States with a correlation coefficient (R) of 0.317 and weighted average of 11.7%, a difference of 6.0%.
Divorced or Separated Correlation Summary
| Measurement | Canadian | Immigrants from Kazakhstan |
| Minimum | 1.4% | 3.3% |
| Maximum | 100.0% | 27.6% |
| Range | 98.6% | 24.3% |
| Mean | 17.8% | 12.8% |
| Median | 15.1% | 12.0% |
| Interquartile 25% (IQ1) | 12.1% | 10.7% |
| Interquartile 75% (IQ3) | 18.4% | 14.3% |
| Interquartile Range (IQR) | 6.3% | 3.6% |
| Standard Deviation (Sample) | 15.3% | 4.6% |
| Standard Deviation (Population) | 15.1% | 4.6% |
Similar Demographics by Divorced or Separated
Demographics Similar to Canadians by Divorced or Separated
In terms of divorced or separated, the demographic groups most similar to Canadians are Malaysian (12.4%, a difference of 0.090%), West Indian (12.4%, a difference of 0.17%), Yugoslavian (12.3%, a difference of 0.19%), Immigrants from Bosnia and Herzegovina (12.4%, a difference of 0.19%), and Colombian (12.4%, a difference of 0.21%).
| Demographics | Rating | Rank | Divorced or Separated |
| Belgians | 9.7 /100 | #225 | Tragic 12.3% |
| Immigrants | Western Africa | 9.3 /100 | #226 | Tragic 12.3% |
| Hmong | 8.8 /100 | #227 | Tragic 12.3% |
| Immigrants | Cameroon | 8.3 /100 | #228 | Tragic 12.3% |
| Immigrants | Sudan | 8.2 /100 | #229 | Tragic 12.3% |
| Yakama | 7.8 /100 | #230 | Tragic 12.3% |
| Yugoslavians | 6.6 /100 | #231 | Tragic 12.3% |
| Canadians | 5.3 /100 | #232 | Tragic 12.4% |
| Malaysians | 4.8 /100 | #233 | Tragic 12.4% |
| West Indians | 4.4 /100 | #234 | Tragic 12.4% |
| Immigrants | Bosnia and Herzegovina | 4.3 /100 | #235 | Tragic 12.4% |
| Colombians | 4.2 /100 | #236 | Tragic 12.4% |
| Immigrants | Laos | 4.2 /100 | #237 | Tragic 12.4% |
| Sudanese | 4.0 /100 | #238 | Tragic 12.4% |
| Immigrants | Germany | 4.0 /100 | #239 | Tragic 12.4% |
Demographics Similar to Immigrants from Kazakhstan by Divorced or Separated
In terms of divorced or separated, the demographic groups most similar to Immigrants from Kazakhstan are Immigrants from El Salvador (11.7%, a difference of 0.040%), Salvadoran (11.6%, a difference of 0.16%), Maltese (11.6%, a difference of 0.18%), Native Hawaiian (11.7%, a difference of 0.21%), and Immigrants from Croatia (11.6%, a difference of 0.22%).
| Demographics | Rating | Rank | Divorced or Separated |
| Immigrants | Sweden | 98.6 /100 | #99 | Exceptional 11.6% |
| Immigrants | Northern Europe | 98.6 /100 | #100 | Exceptional 11.6% |
| Immigrants | Guyana | 98.5 /100 | #101 | Exceptional 11.6% |
| Immigrants | Croatia | 98.3 /100 | #102 | Exceptional 11.6% |
| Maltese | 98.2 /100 | #103 | Exceptional 11.6% |
| Salvadorans | 98.2 /100 | #104 | Exceptional 11.6% |
| Immigrants | El Salvador | 97.9 /100 | #105 | Exceptional 11.7% |
| Immigrants | Kazakhstan | 97.8 /100 | #106 | Exceptional 11.7% |
| Native Hawaiians | 97.2 /100 | #107 | Exceptional 11.7% |
| Greeks | 96.9 /100 | #108 | Exceptional 11.7% |
| Immigrants | South Africa | 96.9 /100 | #109 | Exceptional 11.7% |
| Immigrants | Czechoslovakia | 96.9 /100 | #110 | Exceptional 11.7% |
| Immigrants | Spain | 96.8 /100 | #111 | Exceptional 11.7% |
| Immigrants | France | 96.6 /100 | #112 | Exceptional 11.7% |
| Estonians | 96.6 /100 | #113 | Exceptional 11.7% |