Canadian vs Moroccan Divorced or Separated
COMPARE
Canadian
Moroccan
Divorced or Separated
Divorced or Separated Comparison
Canadians
Moroccans
12.4%
DIVORCED OR SEPARATED
5.3/ 100
METRIC RATING
232nd/ 347
METRIC RANK
12.1%
DIVORCED OR SEPARATED
34.8/ 100
METRIC RATING
190th/ 347
METRIC RANK
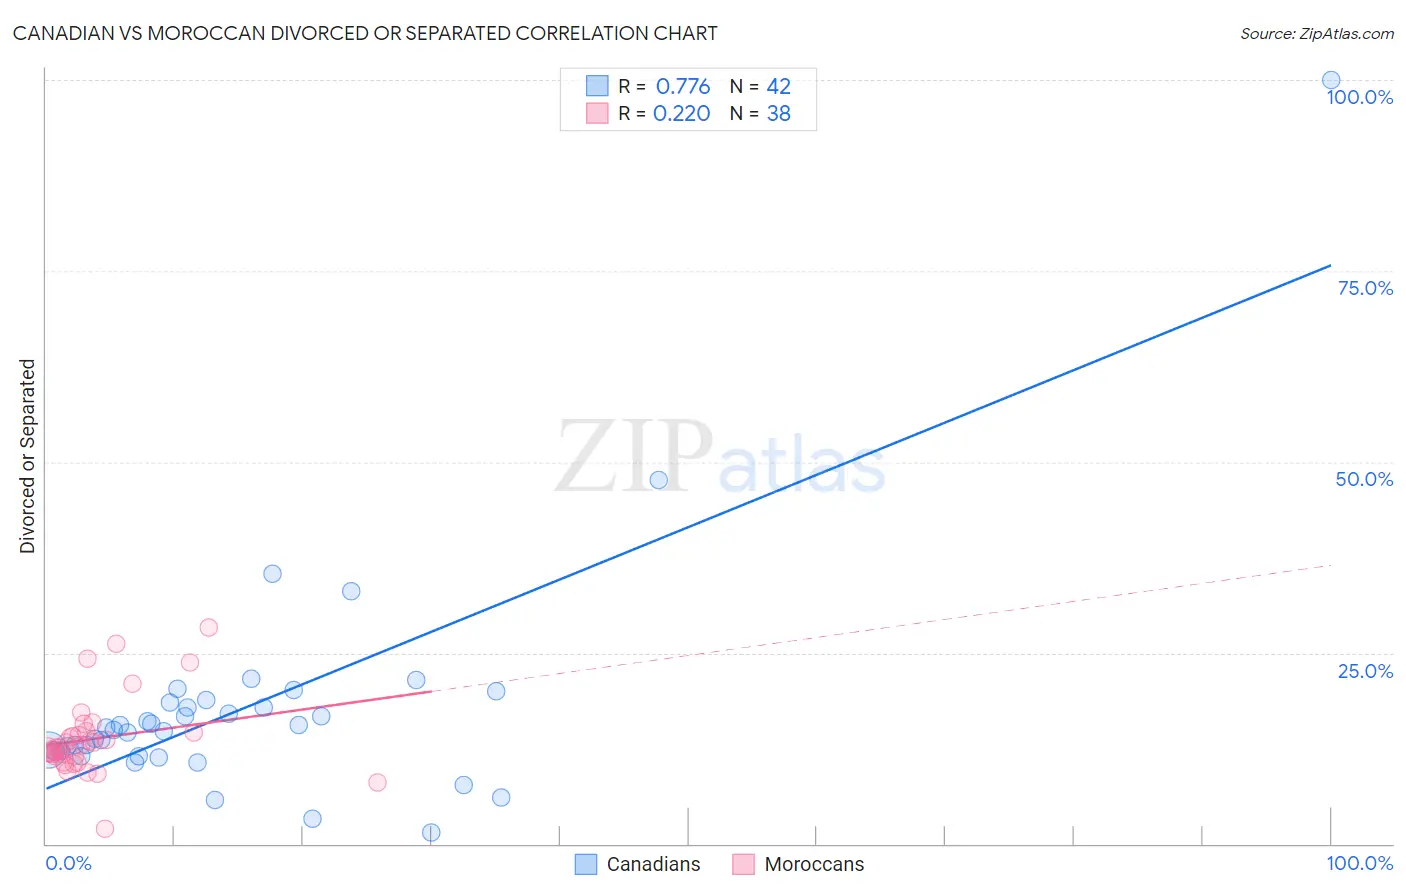
Canadian vs Moroccan Divorced or Separated Correlation Chart
The statistical analysis conducted on geographies consisting of 437,381,276 people shows a strong positive correlation between the proportion of Canadians and percentage of population currently divorced or separated in the United States with a correlation coefficient (R) of 0.776 and weighted average of 12.4%. Similarly, the statistical analysis conducted on geographies consisting of 201,776,444 people shows a weak positive correlation between the proportion of Moroccans and percentage of population currently divorced or separated in the United States with a correlation coefficient (R) of 0.220 and weighted average of 12.1%, a difference of 1.9%.
Divorced or Separated Correlation Summary
| Measurement | Canadian | Moroccan |
| Minimum | 1.4% | 2.0% |
| Maximum | 100.0% | 28.3% |
| Range | 98.6% | 26.3% |
| Mean | 17.8% | 13.7% |
| Median | 15.1% | 12.6% |
| Interquartile 25% (IQ1) | 12.1% | 11.4% |
| Interquartile 75% (IQ3) | 18.4% | 14.6% |
| Interquartile Range (IQR) | 6.3% | 3.2% |
| Standard Deviation (Sample) | 15.3% | 5.1% |
| Standard Deviation (Population) | 15.1% | 5.0% |
Similar Demographics by Divorced or Separated
Demographics Similar to Canadians by Divorced or Separated
In terms of divorced or separated, the demographic groups most similar to Canadians are Malaysian (12.4%, a difference of 0.090%), West Indian (12.4%, a difference of 0.17%), Yugoslavian (12.3%, a difference of 0.19%), Immigrants from Bosnia and Herzegovina (12.4%, a difference of 0.19%), and Colombian (12.4%, a difference of 0.21%).
| Demographics | Rating | Rank | Divorced or Separated |
| Belgians | 9.7 /100 | #225 | Tragic 12.3% |
| Immigrants | Western Africa | 9.3 /100 | #226 | Tragic 12.3% |
| Hmong | 8.8 /100 | #227 | Tragic 12.3% |
| Immigrants | Cameroon | 8.3 /100 | #228 | Tragic 12.3% |
| Immigrants | Sudan | 8.2 /100 | #229 | Tragic 12.3% |
| Yakama | 7.8 /100 | #230 | Tragic 12.3% |
| Yugoslavians | 6.6 /100 | #231 | Tragic 12.3% |
| Canadians | 5.3 /100 | #232 | Tragic 12.4% |
| Malaysians | 4.8 /100 | #233 | Tragic 12.4% |
| West Indians | 4.4 /100 | #234 | Tragic 12.4% |
| Immigrants | Bosnia and Herzegovina | 4.3 /100 | #235 | Tragic 12.4% |
| Colombians | 4.2 /100 | #236 | Tragic 12.4% |
| Immigrants | Laos | 4.2 /100 | #237 | Tragic 12.4% |
| Sudanese | 4.0 /100 | #238 | Tragic 12.4% |
| Immigrants | Germany | 4.0 /100 | #239 | Tragic 12.4% |
Demographics Similar to Moroccans by Divorced or Separated
In terms of divorced or separated, the demographic groups most similar to Moroccans are Swedish (12.1%, a difference of 0.020%), Sierra Leonean (12.1%, a difference of 0.030%), Norwegian (12.1%, a difference of 0.060%), Immigrants from Thailand (12.1%, a difference of 0.090%), and Immigrants from Belize (12.1%, a difference of 0.10%).
| Demographics | Rating | Rank | Divorced or Separated |
| Immigrants | Central America | 42.9 /100 | #183 | Average 12.1% |
| Immigrants | North America | 41.1 /100 | #184 | Average 12.1% |
| Immigrants | Nigeria | 40.5 /100 | #185 | Average 12.1% |
| Immigrants | Chile | 39.0 /100 | #186 | Fair 12.1% |
| Belizeans | 37.7 /100 | #187 | Fair 12.1% |
| Immigrants | Belize | 37.6 /100 | #188 | Fair 12.1% |
| Sierra Leoneans | 35.5 /100 | #189 | Fair 12.1% |
| Moroccans | 34.8 /100 | #190 | Fair 12.1% |
| Swedes | 34.4 /100 | #191 | Fair 12.1% |
| Norwegians | 33.2 /100 | #192 | Fair 12.1% |
| Immigrants | Thailand | 32.5 /100 | #193 | Fair 12.1% |
| Immigrants | Eritrea | 31.9 /100 | #194 | Fair 12.1% |
| Immigrants | England | 31.4 /100 | #195 | Fair 12.1% |
| Immigrants | Burma/Myanmar | 30.4 /100 | #196 | Fair 12.1% |
| Immigrants | Africa | 30.3 /100 | #197 | Fair 12.1% |