Canadian vs Immigrants from Bolivia Divorced or Separated
COMPARE
Canadian
Immigrants from Bolivia
Divorced or Separated
Divorced or Separated Comparison
Canadians
Immigrants from Bolivia
12.4%
DIVORCED OR SEPARATED
5.3/ 100
METRIC RATING
232nd/ 347
METRIC RANK
11.3%
DIVORCED OR SEPARATED
100.0/ 100
METRIC RATING
51st/ 347
METRIC RANK
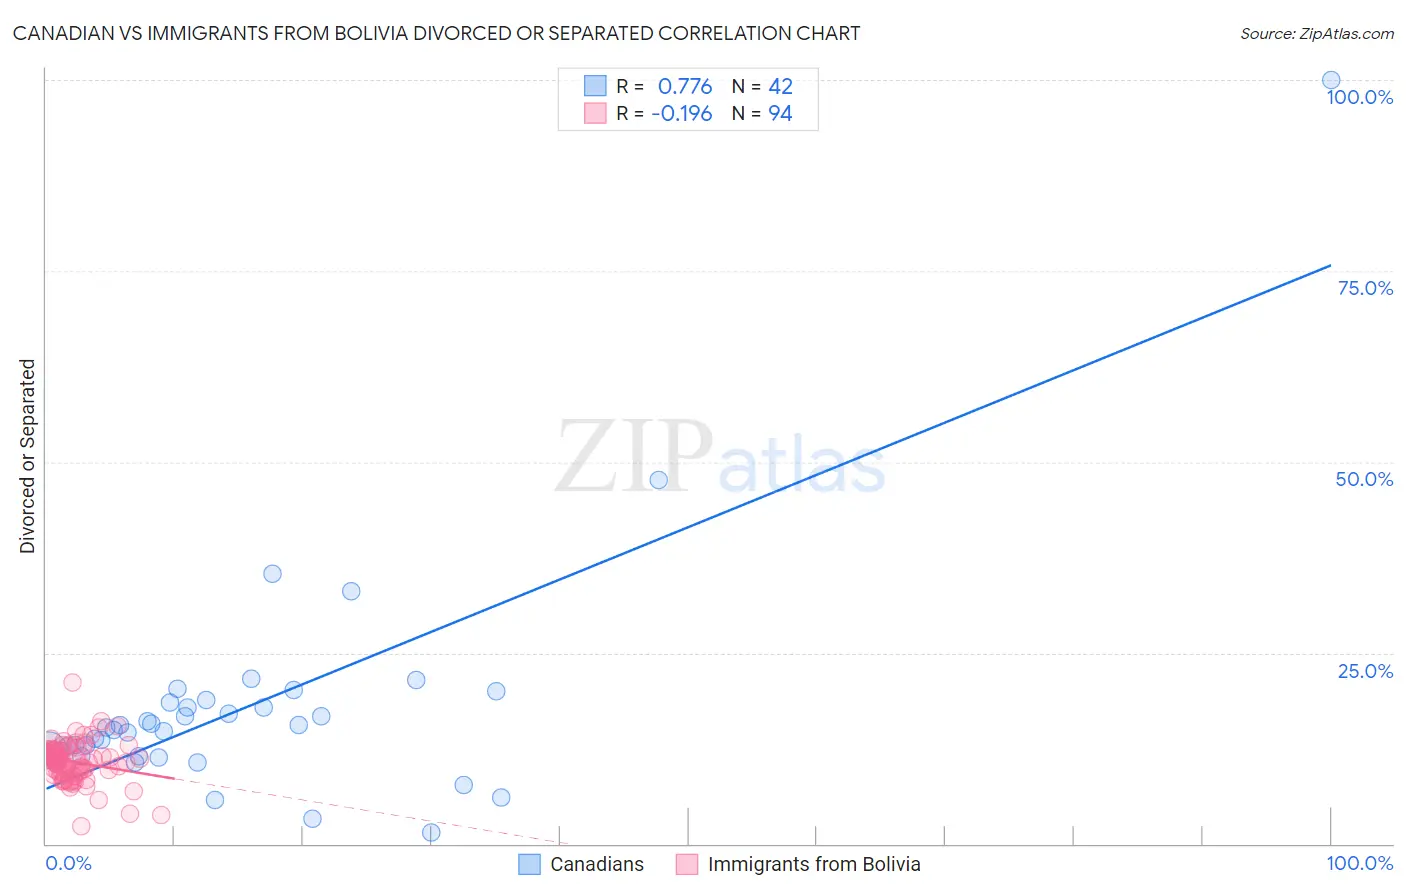
Canadian vs Immigrants from Bolivia Divorced or Separated Correlation Chart
The statistical analysis conducted on geographies consisting of 437,381,276 people shows a strong positive correlation between the proportion of Canadians and percentage of population currently divorced or separated in the United States with a correlation coefficient (R) of 0.776 and weighted average of 12.4%. Similarly, the statistical analysis conducted on geographies consisting of 158,719,701 people shows a poor negative correlation between the proportion of Immigrants from Bolivia and percentage of population currently divorced or separated in the United States with a correlation coefficient (R) of -0.196 and weighted average of 11.3%, a difference of 9.8%.
Divorced or Separated Correlation Summary
| Measurement | Canadian | Immigrants from Bolivia |
| Minimum | 1.4% | 2.4% |
| Maximum | 100.0% | 21.1% |
| Range | 98.6% | 18.7% |
| Mean | 17.8% | 10.7% |
| Median | 15.1% | 11.0% |
| Interquartile 25% (IQ1) | 12.1% | 9.4% |
| Interquartile 75% (IQ3) | 18.4% | 12.1% |
| Interquartile Range (IQR) | 6.3% | 2.8% |
| Standard Deviation (Sample) | 15.3% | 2.6% |
| Standard Deviation (Population) | 15.1% | 2.6% |
Similar Demographics by Divorced or Separated
Demographics Similar to Canadians by Divorced or Separated
In terms of divorced or separated, the demographic groups most similar to Canadians are Malaysian (12.4%, a difference of 0.090%), West Indian (12.4%, a difference of 0.17%), Yugoslavian (12.3%, a difference of 0.19%), Immigrants from Bosnia and Herzegovina (12.4%, a difference of 0.19%), and Colombian (12.4%, a difference of 0.21%).
| Demographics | Rating | Rank | Divorced or Separated |
| Belgians | 9.7 /100 | #225 | Tragic 12.3% |
| Immigrants | Western Africa | 9.3 /100 | #226 | Tragic 12.3% |
| Hmong | 8.8 /100 | #227 | Tragic 12.3% |
| Immigrants | Cameroon | 8.3 /100 | #228 | Tragic 12.3% |
| Immigrants | Sudan | 8.2 /100 | #229 | Tragic 12.3% |
| Yakama | 7.8 /100 | #230 | Tragic 12.3% |
| Yugoslavians | 6.6 /100 | #231 | Tragic 12.3% |
| Canadians | 5.3 /100 | #232 | Tragic 12.4% |
| Malaysians | 4.8 /100 | #233 | Tragic 12.4% |
| West Indians | 4.4 /100 | #234 | Tragic 12.4% |
| Immigrants | Bosnia and Herzegovina | 4.3 /100 | #235 | Tragic 12.4% |
| Colombians | 4.2 /100 | #236 | Tragic 12.4% |
| Immigrants | Laos | 4.2 /100 | #237 | Tragic 12.4% |
| Sudanese | 4.0 /100 | #238 | Tragic 12.4% |
| Immigrants | Germany | 4.0 /100 | #239 | Tragic 12.4% |
Demographics Similar to Immigrants from Bolivia by Divorced or Separated
In terms of divorced or separated, the demographic groups most similar to Immigrants from Bolivia are Immigrants from Australia (11.3%, a difference of 0.11%), Bolivian (11.2%, a difference of 0.30%), Immigrants from Lithuania (11.3%, a difference of 0.33%), Immigrants from Saudi Arabia (11.2%, a difference of 0.36%), and Immigrants from Turkey (11.2%, a difference of 0.37%).
| Demographics | Rating | Rank | Divorced or Separated |
| Immigrants | Western Asia | 100.0 /100 | #44 | Exceptional 11.2% |
| Turks | 100.0 /100 | #45 | Exceptional 11.2% |
| Laotians | 100.0 /100 | #46 | Exceptional 11.2% |
| Immigrants | Poland | 100.0 /100 | #47 | Exceptional 11.2% |
| Immigrants | Turkey | 100.0 /100 | #48 | Exceptional 11.2% |
| Immigrants | Saudi Arabia | 100.0 /100 | #49 | Exceptional 11.2% |
| Bolivians | 100.0 /100 | #50 | Exceptional 11.2% |
| Immigrants | Bolivia | 100.0 /100 | #51 | Exceptional 11.3% |
| Immigrants | Australia | 99.9 /100 | #52 | Exceptional 11.3% |
| Immigrants | Lithuania | 99.9 /100 | #53 | Exceptional 11.3% |
| Eastern Europeans | 99.9 /100 | #54 | Exceptional 11.3% |
| Immigrants | Yemen | 99.9 /100 | #55 | Exceptional 11.3% |
| Immigrants | Philippines | 99.9 /100 | #56 | Exceptional 11.3% |
| Immigrants | Vietnam | 99.9 /100 | #57 | Exceptional 11.3% |
| Sri Lankans | 99.9 /100 | #58 | Exceptional 11.3% |