Canadian vs Indian (Asian) Currently Married
COMPARE
Canadian
Indian (Asian)
Currently Married
Currently Married Comparison
Canadians
Indians (Asian)
48.3%
CURRENTLY MARRIED
98.1/ 100
METRIC RATING
69th/ 347
METRIC RANK
48.0%
CURRENTLY MARRIED
95.8/ 100
METRIC RATING
89th/ 347
METRIC RANK
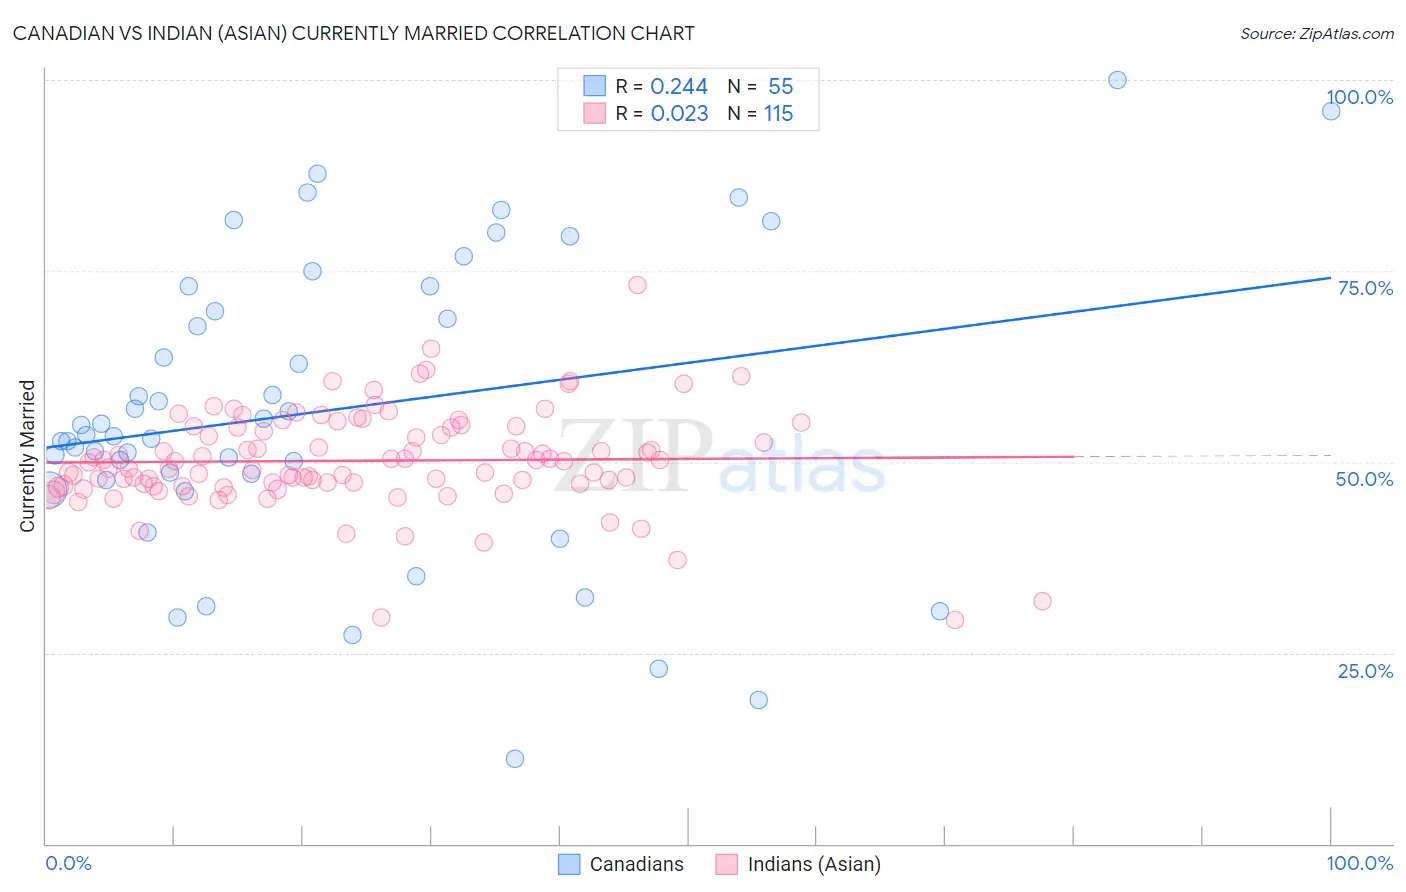
Canadian vs Indian (Asian) Currently Married Correlation Chart
The statistical analysis conducted on geographies consisting of 437,507,905 people shows a weak positive correlation between the proportion of Canadians and percentage of population currently married in the United States with a correlation coefficient (R) of 0.244 and weighted average of 48.3%. Similarly, the statistical analysis conducted on geographies consisting of 495,221,745 people shows no correlation between the proportion of Indians (Asian) and percentage of population currently married in the United States with a correlation coefficient (R) of 0.023 and weighted average of 48.0%, a difference of 0.74%.
Currently Married Correlation Summary
| Measurement | Canadian | Indian (Asian) |
| Minimum | 11.1% | 29.3% |
| Maximum | 100.0% | 73.2% |
| Range | 88.9% | 43.9% |
| Mean | 56.8% | 50.1% |
| Median | 53.5% | 50.0% |
| Interquartile 25% (IQ1) | 47.6% | 46.9% |
| Interquartile 75% (IQ3) | 73.0% | 54.5% |
| Interquartile Range (IQR) | 25.3% | 7.5% |
| Standard Deviation (Sample) | 19.6% | 6.5% |
| Standard Deviation (Population) | 19.4% | 6.4% |
Demographics Similar to Canadians and Indians (Asian) by Currently Married
In terms of currently married, the demographic groups most similar to Canadians are Immigrants from Asia (48.3%, a difference of 0.090%), Macedonian (48.3%, a difference of 0.090%), Immigrants from Lebanon (48.2%, a difference of 0.24%), Immigrants from Eastern Asia (48.2%, a difference of 0.26%), and Estonian (48.2%, a difference of 0.29%). Similarly, the demographic groups most similar to Indians (Asian) are Immigrants from Eastern Europe (48.0%, a difference of 0.060%), Jordanian (48.0%, a difference of 0.080%), Immigrants from Japan (48.0%, a difference of 0.090%), French Canadian (48.0%, a difference of 0.12%), and Immigrants from Israel (48.1%, a difference of 0.26%).
| Demographics | Rating | Rank | Currently Married |
| Canadians | 98.1 /100 | #69 | Exceptional 48.3% |
| Immigrants | Asia | 97.9 /100 | #70 | Exceptional 48.3% |
| Macedonians | 97.9 /100 | #71 | Exceptional 48.3% |
| Immigrants | Lebanon | 97.6 /100 | #72 | Exceptional 48.2% |
| Immigrants | Eastern Asia | 97.5 /100 | #73 | Exceptional 48.2% |
| Estonians | 97.4 /100 | #74 | Exceptional 48.2% |
| Immigrants | Belarus | 97.2 /100 | #75 | Exceptional 48.1% |
| Basques | 97.2 /100 | #76 | Exceptional 48.1% |
| Slovenes | 97.1 /100 | #77 | Exceptional 48.1% |
| Immigrants | Belgium | 97.1 /100 | #78 | Exceptional 48.1% |
| Immigrants | South Africa | 97.0 /100 | #79 | Exceptional 48.1% |
| Immigrants | Poland | 96.9 /100 | #80 | Exceptional 48.1% |
| Immigrants | Sri Lanka | 96.9 /100 | #81 | Exceptional 48.1% |
| Immigrants | Europe | 96.9 /100 | #82 | Exceptional 48.1% |
| Bolivians | 96.9 /100 | #83 | Exceptional 48.1% |
| Immigrants | Israel | 96.9 /100 | #84 | Exceptional 48.1% |
| French Canadians | 96.3 /100 | #85 | Exceptional 48.0% |
| Immigrants | Japan | 96.2 /100 | #86 | Exceptional 48.0% |
| Jordanians | 96.2 /100 | #87 | Exceptional 48.0% |
| Immigrants | Eastern Europe | 96.1 /100 | #88 | Exceptional 48.0% |
| Indians (Asian) | 95.8 /100 | #89 | Exceptional 48.0% |