Canadian vs Immigrants from Middle Africa Currently Married
COMPARE
Canadian
Immigrants from Middle Africa
Currently Married
Currently Married Comparison
Canadians
Immigrants from Middle Africa
48.3%
CURRENTLY MARRIED
98.1/ 100
METRIC RATING
69th/ 347
METRIC RANK
43.0%
CURRENTLY MARRIED
0.0/ 100
METRIC RATING
285th/ 347
METRIC RANK
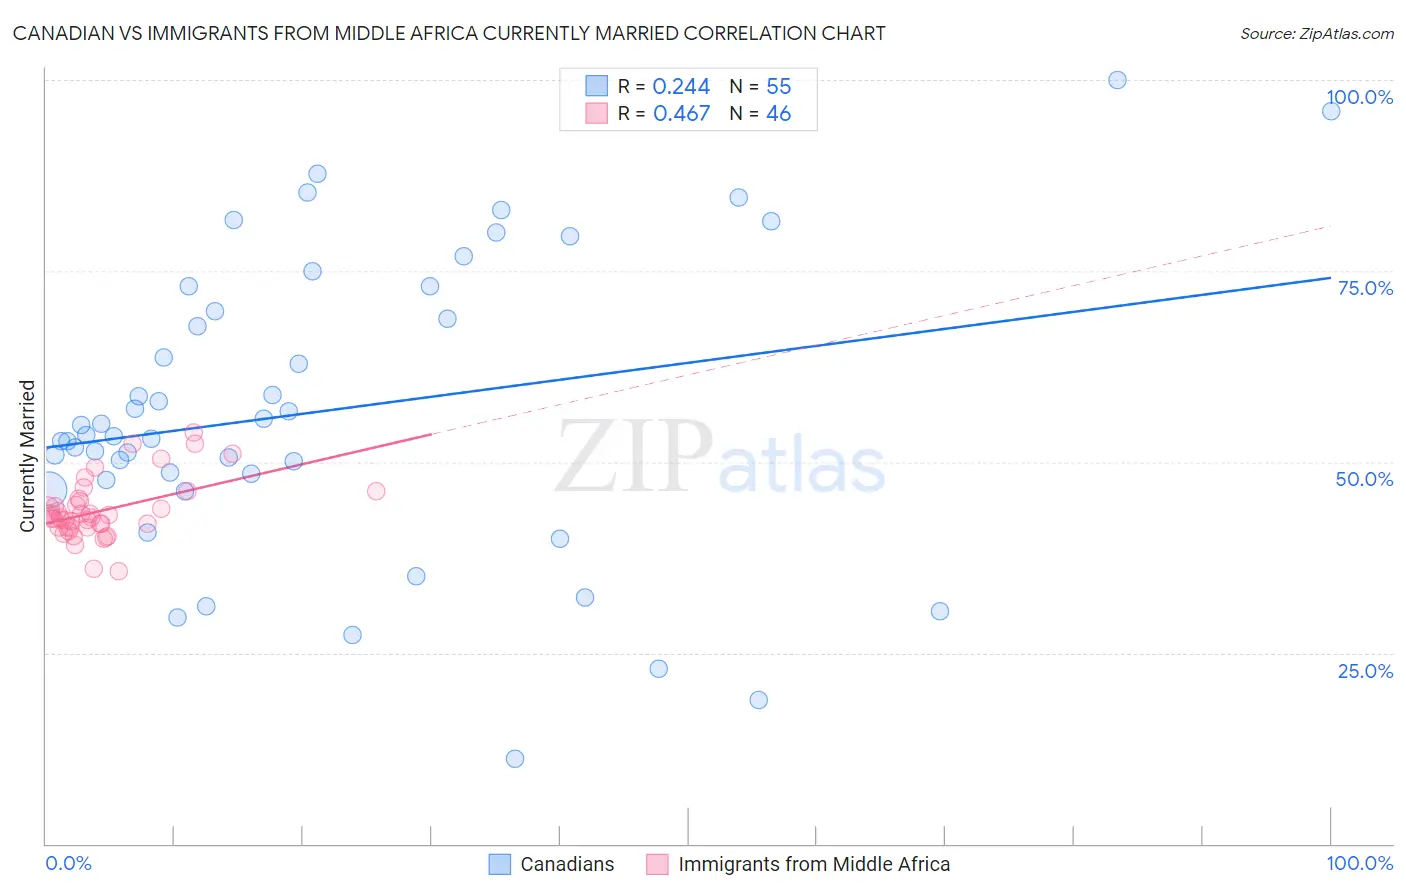
Canadian vs Immigrants from Middle Africa Currently Married Correlation Chart
The statistical analysis conducted on geographies consisting of 437,507,905 people shows a weak positive correlation between the proportion of Canadians and percentage of population currently married in the United States with a correlation coefficient (R) of 0.244 and weighted average of 48.3%. Similarly, the statistical analysis conducted on geographies consisting of 202,724,037 people shows a moderate positive correlation between the proportion of Immigrants from Middle Africa and percentage of population currently married in the United States with a correlation coefficient (R) of 0.467 and weighted average of 43.0%, a difference of 12.4%.
Currently Married Correlation Summary
| Measurement | Canadian | Immigrants from Middle Africa |
| Minimum | 11.1% | 35.6% |
| Maximum | 100.0% | 53.8% |
| Range | 88.9% | 18.2% |
| Mean | 56.8% | 43.6% |
| Median | 53.5% | 42.8% |
| Interquartile 25% (IQ1) | 47.6% | 41.4% |
| Interquartile 75% (IQ3) | 73.0% | 44.8% |
| Interquartile Range (IQR) | 25.3% | 3.4% |
| Standard Deviation (Sample) | 19.6% | 3.9% |
| Standard Deviation (Population) | 19.4% | 3.8% |
Similar Demographics by Currently Married
Demographics Similar to Canadians by Currently Married
In terms of currently married, the demographic groups most similar to Canadians are Slovak (48.3%, a difference of 0.020%), Immigrants from England (48.3%, a difference of 0.020%), Tongan (48.3%, a difference of 0.040%), Immigrants from Czechoslovakia (48.4%, a difference of 0.070%), and Ukrainian (48.4%, a difference of 0.070%).
| Demographics | Rating | Rank | Currently Married |
| Asians | 98.5 /100 | #62 | Exceptional 48.4% |
| Slavs | 98.3 /100 | #63 | Exceptional 48.4% |
| Immigrants | Czechoslovakia | 98.3 /100 | #64 | Exceptional 48.4% |
| Ukrainians | 98.3 /100 | #65 | Exceptional 48.4% |
| Tongans | 98.2 /100 | #66 | Exceptional 48.3% |
| Slovaks | 98.2 /100 | #67 | Exceptional 48.3% |
| Immigrants | England | 98.2 /100 | #68 | Exceptional 48.3% |
| Canadians | 98.1 /100 | #69 | Exceptional 48.3% |
| Immigrants | Asia | 97.9 /100 | #70 | Exceptional 48.3% |
| Macedonians | 97.9 /100 | #71 | Exceptional 48.3% |
| Immigrants | Lebanon | 97.6 /100 | #72 | Exceptional 48.2% |
| Immigrants | Eastern Asia | 97.5 /100 | #73 | Exceptional 48.2% |
| Estonians | 97.4 /100 | #74 | Exceptional 48.2% |
| Immigrants | Belarus | 97.2 /100 | #75 | Exceptional 48.1% |
| Basques | 97.2 /100 | #76 | Exceptional 48.1% |
Demographics Similar to Immigrants from Middle Africa by Currently Married
In terms of currently married, the demographic groups most similar to Immigrants from Middle Africa are Ghanaian (42.9%, a difference of 0.13%), Guatemalan (42.9%, a difference of 0.15%), Kiowa (43.2%, a difference of 0.40%), Immigrants from El Salvador (43.1%, a difference of 0.40%), and Native/Alaskan (42.8%, a difference of 0.42%).
| Demographics | Rating | Rank | Currently Married |
| Central Americans | 0.0 /100 | #278 | Tragic 43.3% |
| Central American Indians | 0.0 /100 | #279 | Tragic 43.3% |
| Apache | 0.0 /100 | #280 | Tragic 43.2% |
| Chippewa | 0.0 /100 | #281 | Tragic 43.2% |
| Immigrants | Ecuador | 0.0 /100 | #282 | Tragic 43.2% |
| Kiowa | 0.0 /100 | #283 | Tragic 43.2% |
| Immigrants | El Salvador | 0.0 /100 | #284 | Tragic 43.1% |
| Immigrants | Middle Africa | 0.0 /100 | #285 | Tragic 43.0% |
| Ghanaians | 0.0 /100 | #286 | Tragic 42.9% |
| Guatemalans | 0.0 /100 | #287 | Tragic 42.9% |
| Natives/Alaskans | 0.0 /100 | #288 | Tragic 42.8% |
| Paiute | 0.0 /100 | #289 | Tragic 42.7% |
| Immigrants | Ghana | 0.0 /100 | #290 | Tragic 42.7% |
| Immigrants | Guatemala | 0.0 /100 | #291 | Tragic 42.6% |
| Sub-Saharan Africans | 0.0 /100 | #292 | Tragic 42.6% |