Canadian vs Indian (Asian) High School Diploma
COMPARE
Canadian
Indian (Asian)
High School Diploma
High School Diploma Comparison
Canadians
Indians (Asian)
90.6%
HIGH SCHOOL DIPLOMA
98.7/ 100
METRIC RATING
89th/ 347
METRIC RANK
89.6%
HIGH SCHOOL DIPLOMA
78.8/ 100
METRIC RATING
142nd/ 347
METRIC RANK
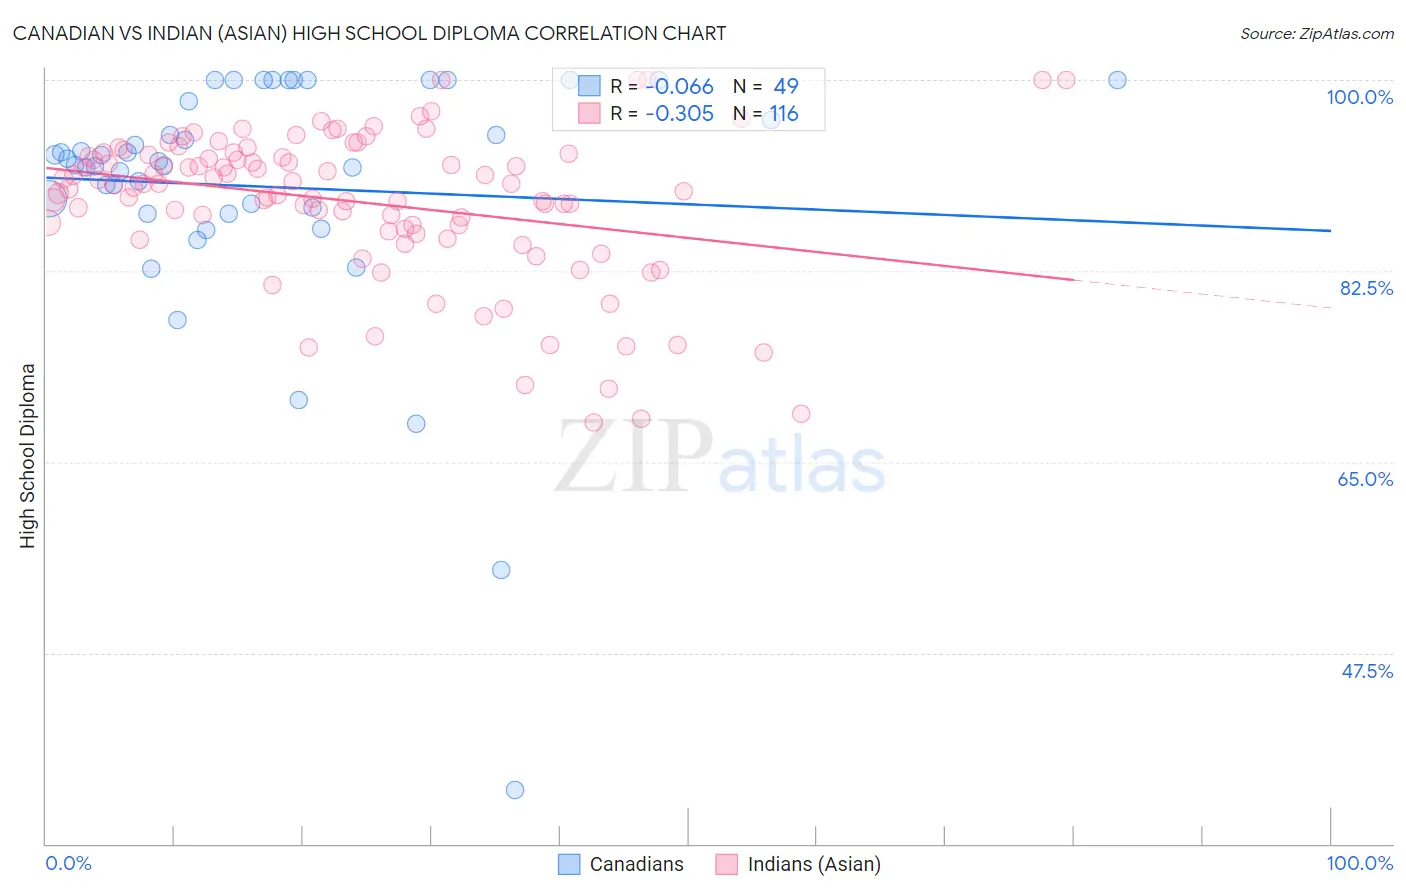
Canadian vs Indian (Asian) High School Diploma Correlation Chart
The statistical analysis conducted on geographies consisting of 437,556,595 people shows a slight negative correlation between the proportion of Canadians and percentage of population with at least high school diploma education in the United States with a correlation coefficient (R) of -0.066 and weighted average of 90.6%. Similarly, the statistical analysis conducted on geographies consisting of 495,347,994 people shows a mild negative correlation between the proportion of Indians (Asian) and percentage of population with at least high school diploma education in the United States with a correlation coefficient (R) of -0.305 and weighted average of 89.6%, a difference of 1.1%.
High School Diploma Correlation Summary
| Measurement | Canadian | Indian (Asian) |
| Minimum | 34.9% | 68.7% |
| Maximum | 100.0% | 100.0% |
| Range | 65.1% | 31.3% |
| Mean | 90.2% | 88.8% |
| Median | 92.6% | 90.4% |
| Interquartile 25% (IQ1) | 88.1% | 86.3% |
| Interquartile 75% (IQ3) | 99.0% | 93.2% |
| Interquartile Range (IQR) | 11.0% | 6.9% |
| Standard Deviation (Sample) | 12.0% | 6.8% |
| Standard Deviation (Population) | 11.9% | 6.8% |
Similar Demographics by High School Diploma
Demographics Similar to Canadians by High School Diploma
In terms of high school diploma, the demographic groups most similar to Canadians are Celtic (90.6%, a difference of 0.010%), Immigrants from France (90.6%, a difference of 0.020%), South African (90.6%, a difference of 0.030%), Immigrants from Bulgaria (90.6%, a difference of 0.040%), and Immigrants from Turkey (90.6%, a difference of 0.040%).
| Demographics | Rating | Rank | High School Diploma |
| Scotch-Irish | 99.2 /100 | #82 | Exceptional 90.8% |
| Immigrants | Moldova | 99.2 /100 | #83 | Exceptional 90.7% |
| Immigrants | Saudi Arabia | 99.1 /100 | #84 | Exceptional 90.7% |
| Romanians | 98.9 /100 | #85 | Exceptional 90.7% |
| Immigrants | Bulgaria | 98.9 /100 | #86 | Exceptional 90.6% |
| Immigrants | Turkey | 98.9 /100 | #87 | Exceptional 90.6% |
| Immigrants | France | 98.8 /100 | #88 | Exceptional 90.6% |
| Canadians | 98.7 /100 | #89 | Exceptional 90.6% |
| Celtics | 98.7 /100 | #90 | Exceptional 90.6% |
| South Africans | 98.6 /100 | #91 | Exceptional 90.6% |
| Swiss | 98.6 /100 | #92 | Exceptional 90.6% |
| Immigrants | Western Europe | 98.6 /100 | #93 | Exceptional 90.6% |
| Immigrants | Israel | 98.5 /100 | #94 | Exceptional 90.5% |
| Icelanders | 98.5 /100 | #95 | Exceptional 90.5% |
| Immigrants | Serbia | 98.4 /100 | #96 | Exceptional 90.5% |
Demographics Similar to Indians (Asian) by High School Diploma
In terms of high school diploma, the demographic groups most similar to Indians (Asian) are Chilean (89.6%, a difference of 0.0%), Pakistani (89.6%, a difference of 0.010%), Immigrants from Kenya (89.6%, a difference of 0.020%), Immigrants from Brazil (89.5%, a difference of 0.050%), and Kenyan (89.6%, a difference of 0.060%).
| Demographics | Rating | Rank | High School Diploma |
| Chippewa | 85.6 /100 | #135 | Excellent 89.7% |
| Ugandans | 83.7 /100 | #136 | Excellent 89.7% |
| Arabs | 83.6 /100 | #137 | Excellent 89.7% |
| Assyrians/Chaldeans/Syriacs | 82.5 /100 | #138 | Excellent 89.7% |
| Kenyans | 81.4 /100 | #139 | Excellent 89.6% |
| Immigrants | Egypt | 81.2 /100 | #140 | Excellent 89.6% |
| Chileans | 79.0 /100 | #141 | Good 89.6% |
| Indians (Asian) | 78.8 /100 | #142 | Good 89.6% |
| Pakistanis | 78.3 /100 | #143 | Good 89.6% |
| Immigrants | Kenya | 78.0 /100 | #144 | Good 89.6% |
| Immigrants | Brazil | 76.6 /100 | #145 | Good 89.5% |
| Immigrants | Spain | 76.2 /100 | #146 | Good 89.5% |
| Iraqis | 73.9 /100 | #147 | Good 89.5% |
| Immigrants | Lebanon | 73.4 /100 | #148 | Good 89.5% |
| Immigrants | Poland | 72.9 /100 | #149 | Good 89.5% |