Canadian vs Immigrants from Southern Europe Currently Married
COMPARE
Canadian
Immigrants from Southern Europe
Currently Married
Currently Married Comparison
Canadians
Immigrants from Southern Europe
48.3%
CURRENTLY MARRIED
98.1/ 100
METRIC RATING
69th/ 347
METRIC RANK
46.9%
CURRENTLY MARRIED
65.9/ 100
METRIC RATING
161st/ 347
METRIC RANK
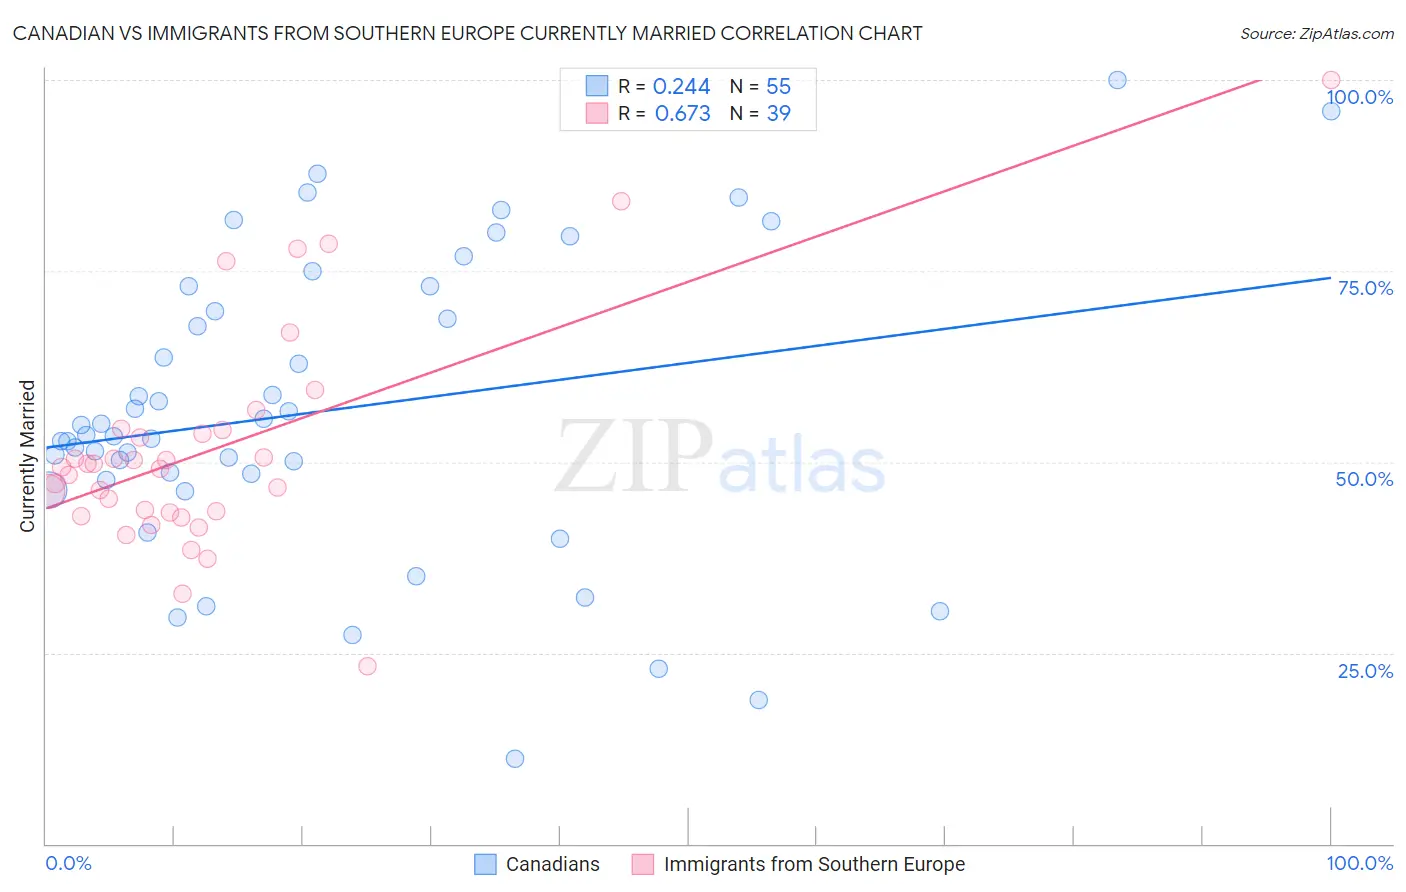
Canadian vs Immigrants from Southern Europe Currently Married Correlation Chart
The statistical analysis conducted on geographies consisting of 437,507,905 people shows a weak positive correlation between the proportion of Canadians and percentage of population currently married in the United States with a correlation coefficient (R) of 0.244 and weighted average of 48.3%. Similarly, the statistical analysis conducted on geographies consisting of 402,740,991 people shows a significant positive correlation between the proportion of Immigrants from Southern Europe and percentage of population currently married in the United States with a correlation coefficient (R) of 0.673 and weighted average of 46.9%, a difference of 3.0%.
Currently Married Correlation Summary
| Measurement | Canadian | Immigrants from Southern Europe |
| Minimum | 11.1% | 23.3% |
| Maximum | 100.0% | 100.0% |
| Range | 88.9% | 76.7% |
| Mean | 56.8% | 51.7% |
| Median | 53.5% | 49.3% |
| Interquartile 25% (IQ1) | 47.6% | 43.3% |
| Interquartile 75% (IQ3) | 73.0% | 54.2% |
| Interquartile Range (IQR) | 25.3% | 10.9% |
| Standard Deviation (Sample) | 19.6% | 14.7% |
| Standard Deviation (Population) | 19.4% | 14.5% |
Similar Demographics by Currently Married
Demographics Similar to Canadians by Currently Married
In terms of currently married, the demographic groups most similar to Canadians are Slovak (48.3%, a difference of 0.020%), Immigrants from England (48.3%, a difference of 0.020%), Tongan (48.3%, a difference of 0.040%), Immigrants from Czechoslovakia (48.4%, a difference of 0.070%), and Ukrainian (48.4%, a difference of 0.070%).
| Demographics | Rating | Rank | Currently Married |
| Asians | 98.5 /100 | #62 | Exceptional 48.4% |
| Slavs | 98.3 /100 | #63 | Exceptional 48.4% |
| Immigrants | Czechoslovakia | 98.3 /100 | #64 | Exceptional 48.4% |
| Ukrainians | 98.3 /100 | #65 | Exceptional 48.4% |
| Tongans | 98.2 /100 | #66 | Exceptional 48.3% |
| Slovaks | 98.2 /100 | #67 | Exceptional 48.3% |
| Immigrants | England | 98.2 /100 | #68 | Exceptional 48.3% |
| Canadians | 98.1 /100 | #69 | Exceptional 48.3% |
| Immigrants | Asia | 97.9 /100 | #70 | Exceptional 48.3% |
| Macedonians | 97.9 /100 | #71 | Exceptional 48.3% |
| Immigrants | Lebanon | 97.6 /100 | #72 | Exceptional 48.2% |
| Immigrants | Eastern Asia | 97.5 /100 | #73 | Exceptional 48.2% |
| Estonians | 97.4 /100 | #74 | Exceptional 48.2% |
| Immigrants | Belarus | 97.2 /100 | #75 | Exceptional 48.1% |
| Basques | 97.2 /100 | #76 | Exceptional 48.1% |
Demographics Similar to Immigrants from Southern Europe by Currently Married
In terms of currently married, the demographic groups most similar to Immigrants from Southern Europe are Immigrants from Uzbekistan (46.9%, a difference of 0.0%), Iraqi (46.9%, a difference of 0.020%), Nonimmigrants (46.9%, a difference of 0.020%), Cherokee (46.9%, a difference of 0.030%), and Delaware (46.9%, a difference of 0.050%).
| Demographics | Rating | Rank | Currently Married |
| Albanians | 68.6 /100 | #154 | Good 47.0% |
| Arabs | 68.6 /100 | #155 | Good 47.0% |
| Spanish | 68.1 /100 | #156 | Good 47.0% |
| Immigrants | Switzerland | 67.8 /100 | #157 | Good 46.9% |
| Cherokee | 66.8 /100 | #158 | Good 46.9% |
| Iraqis | 66.4 /100 | #159 | Good 46.9% |
| Immigrants | Uzbekistan | 66.0 /100 | #160 | Good 46.9% |
| Immigrants | Southern Europe | 65.9 /100 | #161 | Good 46.9% |
| Immigrants | Nonimmigrants | 65.4 /100 | #162 | Good 46.9% |
| Delaware | 64.7 /100 | #163 | Good 46.9% |
| Immigrants | Western Asia | 64.2 /100 | #164 | Good 46.9% |
| Samoans | 59.8 /100 | #165 | Average 46.8% |
| Immigrants | Syria | 59.3 /100 | #166 | Average 46.8% |
| Spaniards | 58.8 /100 | #167 | Average 46.8% |
| Immigrants | Afghanistan | 58.2 /100 | #168 | Average 46.8% |