Canadian vs Immigrants from West Indies Currently Married
COMPARE
Canadian
Immigrants from West Indies
Currently Married
Currently Married Comparison
Canadians
Immigrants from West Indies
48.3%
CURRENTLY MARRIED
98.1/ 100
METRIC RATING
69th/ 347
METRIC RANK
40.7%
CURRENTLY MARRIED
0.0/ 100
METRIC RATING
323rd/ 347
METRIC RANK
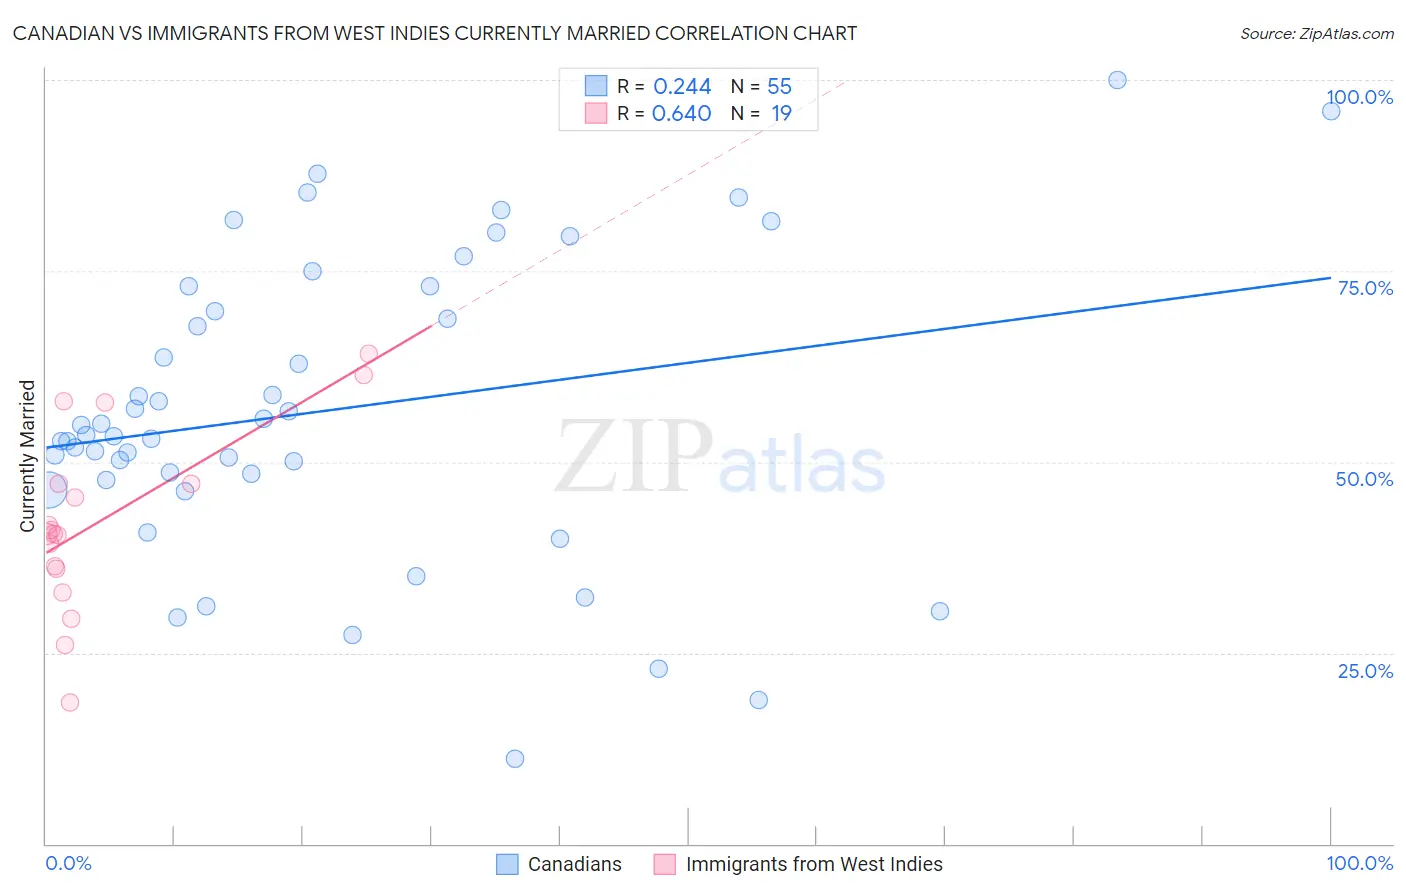
Canadian vs Immigrants from West Indies Currently Married Correlation Chart
The statistical analysis conducted on geographies consisting of 437,507,905 people shows a weak positive correlation between the proportion of Canadians and percentage of population currently married in the United States with a correlation coefficient (R) of 0.244 and weighted average of 48.3%. Similarly, the statistical analysis conducted on geographies consisting of 72,457,514 people shows a significant positive correlation between the proportion of Immigrants from West Indies and percentage of population currently married in the United States with a correlation coefficient (R) of 0.640 and weighted average of 40.7%, a difference of 18.7%.
Currently Married Correlation Summary
| Measurement | Canadian | Immigrants from West Indies |
| Minimum | 11.1% | 18.5% |
| Maximum | 100.0% | 64.2% |
| Range | 88.9% | 45.7% |
| Mean | 56.8% | 42.3% |
| Median | 53.5% | 40.6% |
| Interquartile 25% (IQ1) | 47.6% | 36.1% |
| Interquartile 75% (IQ3) | 73.0% | 47.1% |
| Interquartile Range (IQR) | 25.3% | 11.0% |
| Standard Deviation (Sample) | 19.6% | 11.9% |
| Standard Deviation (Population) | 19.4% | 11.6% |
Similar Demographics by Currently Married
Demographics Similar to Canadians by Currently Married
In terms of currently married, the demographic groups most similar to Canadians are Slovak (48.3%, a difference of 0.020%), Immigrants from England (48.3%, a difference of 0.020%), Tongan (48.3%, a difference of 0.040%), Immigrants from Czechoslovakia (48.4%, a difference of 0.070%), and Ukrainian (48.4%, a difference of 0.070%).
| Demographics | Rating | Rank | Currently Married |
| Asians | 98.5 /100 | #62 | Exceptional 48.4% |
| Slavs | 98.3 /100 | #63 | Exceptional 48.4% |
| Immigrants | Czechoslovakia | 98.3 /100 | #64 | Exceptional 48.4% |
| Ukrainians | 98.3 /100 | #65 | Exceptional 48.4% |
| Tongans | 98.2 /100 | #66 | Exceptional 48.3% |
| Slovaks | 98.2 /100 | #67 | Exceptional 48.3% |
| Immigrants | England | 98.2 /100 | #68 | Exceptional 48.3% |
| Canadians | 98.1 /100 | #69 | Exceptional 48.3% |
| Immigrants | Asia | 97.9 /100 | #70 | Exceptional 48.3% |
| Macedonians | 97.9 /100 | #71 | Exceptional 48.3% |
| Immigrants | Lebanon | 97.6 /100 | #72 | Exceptional 48.2% |
| Immigrants | Eastern Asia | 97.5 /100 | #73 | Exceptional 48.2% |
| Estonians | 97.4 /100 | #74 | Exceptional 48.2% |
| Immigrants | Belarus | 97.2 /100 | #75 | Exceptional 48.1% |
| Basques | 97.2 /100 | #76 | Exceptional 48.1% |
Demographics Similar to Immigrants from West Indies by Currently Married
In terms of currently married, the demographic groups most similar to Immigrants from West Indies are Immigrants from Senegal (40.7%, a difference of 0.010%), U.S. Virgin Islander (40.7%, a difference of 0.060%), Barbadian (40.6%, a difference of 0.20%), Senegalese (40.6%, a difference of 0.37%), and Arapaho (40.5%, a difference of 0.41%).
| Demographics | Rating | Rank | Currently Married |
| Immigrants | Caribbean | 0.0 /100 | #316 | Tragic 41.3% |
| Haitians | 0.0 /100 | #317 | Tragic 41.3% |
| Bahamians | 0.0 /100 | #318 | Tragic 41.2% |
| Immigrants | Somalia | 0.0 /100 | #319 | Tragic 41.2% |
| Immigrants | Jamaica | 0.0 /100 | #320 | Tragic 41.1% |
| Immigrants | Congo | 0.0 /100 | #321 | Tragic 41.1% |
| Immigrants | Haiti | 0.0 /100 | #322 | Tragic 41.0% |
| Immigrants | West Indies | 0.0 /100 | #323 | Tragic 40.7% |
| Immigrants | Senegal | 0.0 /100 | #324 | Tragic 40.7% |
| U.S. Virgin Islanders | 0.0 /100 | #325 | Tragic 40.7% |
| Barbadians | 0.0 /100 | #326 | Tragic 40.6% |
| Senegalese | 0.0 /100 | #327 | Tragic 40.6% |
| Arapaho | 0.0 /100 | #328 | Tragic 40.5% |
| Crow | 0.0 /100 | #329 | Tragic 40.4% |
| Immigrants | Dominica | 0.0 /100 | #330 | Tragic 40.3% |