Croatian vs Indian (Asian) Currently Married
COMPARE
Croatian
Indian (Asian)
Currently Married
Currently Married Comparison
Croatians
Indians (Asian)
48.9%
CURRENTLY MARRIED
99.5/ 100
METRIC RATING
29th/ 347
METRIC RANK
48.0%
CURRENTLY MARRIED
95.8/ 100
METRIC RATING
89th/ 347
METRIC RANK
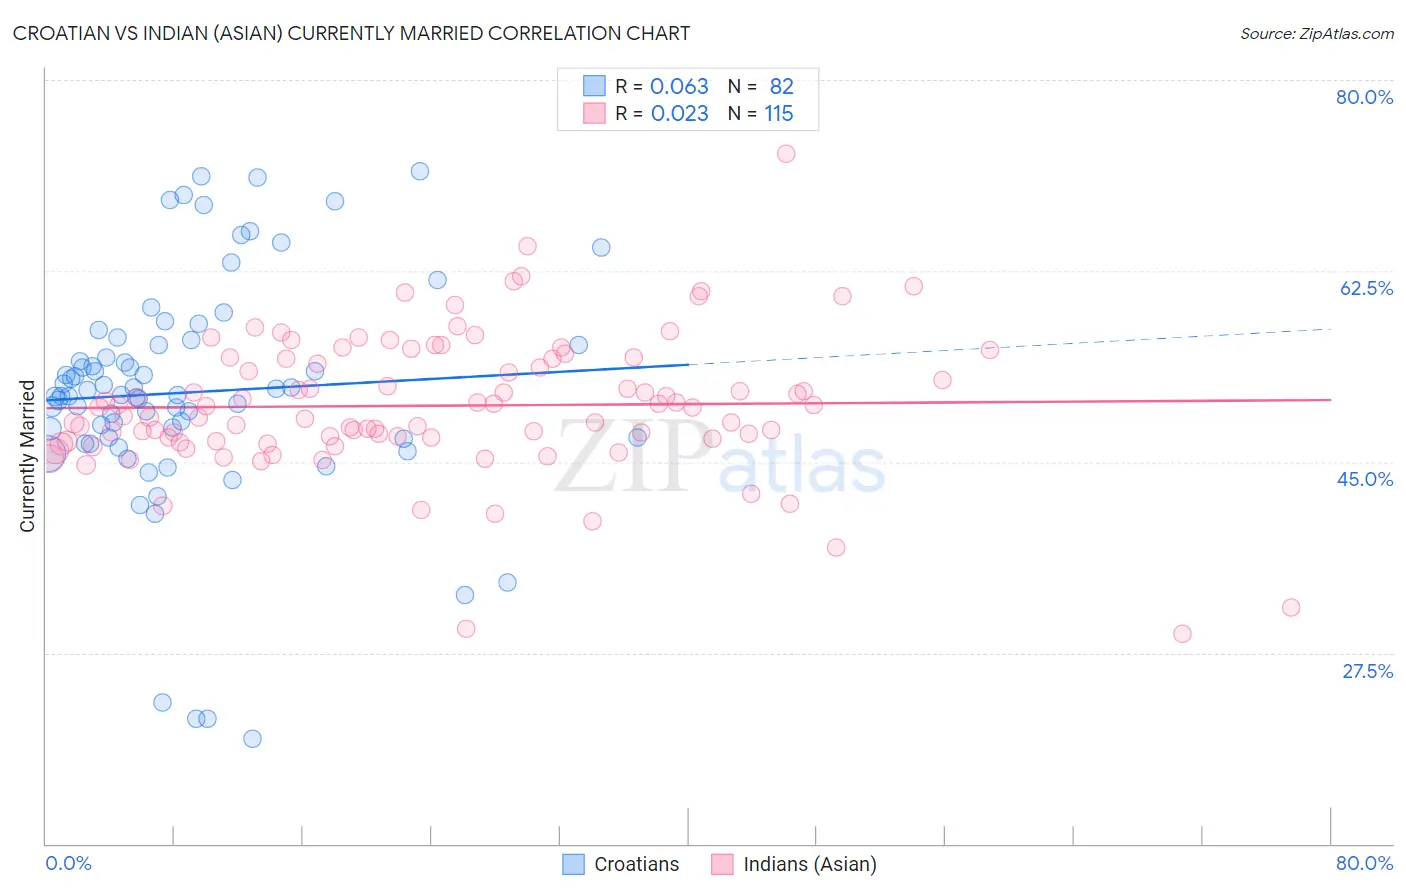
Croatian vs Indian (Asian) Currently Married Correlation Chart
The statistical analysis conducted on geographies consisting of 375,687,747 people shows a slight positive correlation between the proportion of Croatians and percentage of population currently married in the United States with a correlation coefficient (R) of 0.063 and weighted average of 48.9%. Similarly, the statistical analysis conducted on geographies consisting of 495,221,745 people shows no correlation between the proportion of Indians (Asian) and percentage of population currently married in the United States with a correlation coefficient (R) of 0.023 and weighted average of 48.0%, a difference of 1.9%.
Currently Married Correlation Summary
| Measurement | Croatian | Indian (Asian) |
| Minimum | 19.6% | 29.3% |
| Maximum | 71.7% | 73.2% |
| Range | 52.1% | 43.9% |
| Mean | 51.4% | 50.1% |
| Median | 51.1% | 50.0% |
| Interquartile 25% (IQ1) | 47.2% | 46.9% |
| Interquartile 75% (IQ3) | 55.7% | 54.5% |
| Interquartile Range (IQR) | 8.5% | 7.5% |
| Standard Deviation (Sample) | 10.5% | 6.5% |
| Standard Deviation (Population) | 10.4% | 6.4% |
Similar Demographics by Currently Married
Demographics Similar to Croatians by Currently Married
In terms of currently married, the demographic groups most similar to Croatians are Eastern European (48.9%, a difference of 0.010%), Polish (48.9%, a difference of 0.010%), Immigrants from Hong Kong (48.9%, a difference of 0.020%), Welsh (48.9%, a difference of 0.050%), and Irish (48.9%, a difference of 0.060%).
| Demographics | Rating | Rank | Currently Married |
| Bulgarians | 99.7 /100 | #22 | Exceptional 49.1% |
| Immigrants | Pakistan | 99.7 /100 | #23 | Exceptional 49.1% |
| Lithuanians | 99.6 /100 | #24 | Exceptional 49.0% |
| Maltese | 99.6 /100 | #25 | Exceptional 49.0% |
| Immigrants | Korea | 99.6 /100 | #26 | Exceptional 49.0% |
| Burmese | 99.6 /100 | #27 | Exceptional 48.9% |
| Welsh | 99.5 /100 | #28 | Exceptional 48.9% |
| Croatians | 99.5 /100 | #29 | Exceptional 48.9% |
| Eastern Europeans | 99.5 /100 | #30 | Exceptional 48.9% |
| Poles | 99.5 /100 | #31 | Exceptional 48.9% |
| Immigrants | Hong Kong | 99.5 /100 | #32 | Exceptional 48.9% |
| Irish | 99.5 /100 | #33 | Exceptional 48.9% |
| Immigrants | Lithuania | 99.4 /100 | #34 | Exceptional 48.8% |
| Immigrants | Northern Europe | 99.4 /100 | #35 | Exceptional 48.8% |
| Italians | 99.4 /100 | #36 | Exceptional 48.8% |
Demographics Similar to Indians (Asian) by Currently Married
In terms of currently married, the demographic groups most similar to Indians (Asian) are American (48.0%, a difference of 0.020%), Immigrants from Bolivia (47.9%, a difference of 0.050%), Immigrants from Eastern Europe (48.0%, a difference of 0.060%), Jordanian (48.0%, a difference of 0.080%), and Immigrants from Japan (48.0%, a difference of 0.090%).
| Demographics | Rating | Rank | Currently Married |
| Immigrants | Europe | 96.9 /100 | #82 | Exceptional 48.1% |
| Bolivians | 96.9 /100 | #83 | Exceptional 48.1% |
| Immigrants | Israel | 96.9 /100 | #84 | Exceptional 48.1% |
| French Canadians | 96.3 /100 | #85 | Exceptional 48.0% |
| Immigrants | Japan | 96.2 /100 | #86 | Exceptional 48.0% |
| Jordanians | 96.2 /100 | #87 | Exceptional 48.0% |
| Immigrants | Eastern Europe | 96.1 /100 | #88 | Exceptional 48.0% |
| Indians (Asian) | 95.8 /100 | #89 | Exceptional 48.0% |
| Americans | 95.7 /100 | #90 | Exceptional 48.0% |
| Immigrants | Bolivia | 95.6 /100 | #91 | Exceptional 47.9% |
| Koreans | 95.4 /100 | #92 | Exceptional 47.9% |
| Lebanese | 95.1 /100 | #93 | Exceptional 47.9% |
| Native Hawaiians | 95.0 /100 | #94 | Exceptional 47.9% |
| Immigrants | Bulgaria | 94.8 /100 | #95 | Exceptional 47.9% |
| Egyptians | 94.8 /100 | #96 | Exceptional 47.9% |