Immigrants from Indonesia vs Indian (Asian) Currently Married
COMPARE
Immigrants from Indonesia
Indian (Asian)
Currently Married
Currently Married Comparison
Immigrants from Indonesia
Indians (Asian)
47.6%
CURRENTLY MARRIED
90.5/ 100
METRIC RATING
115th/ 347
METRIC RANK
48.0%
CURRENTLY MARRIED
95.8/ 100
METRIC RATING
89th/ 347
METRIC RANK
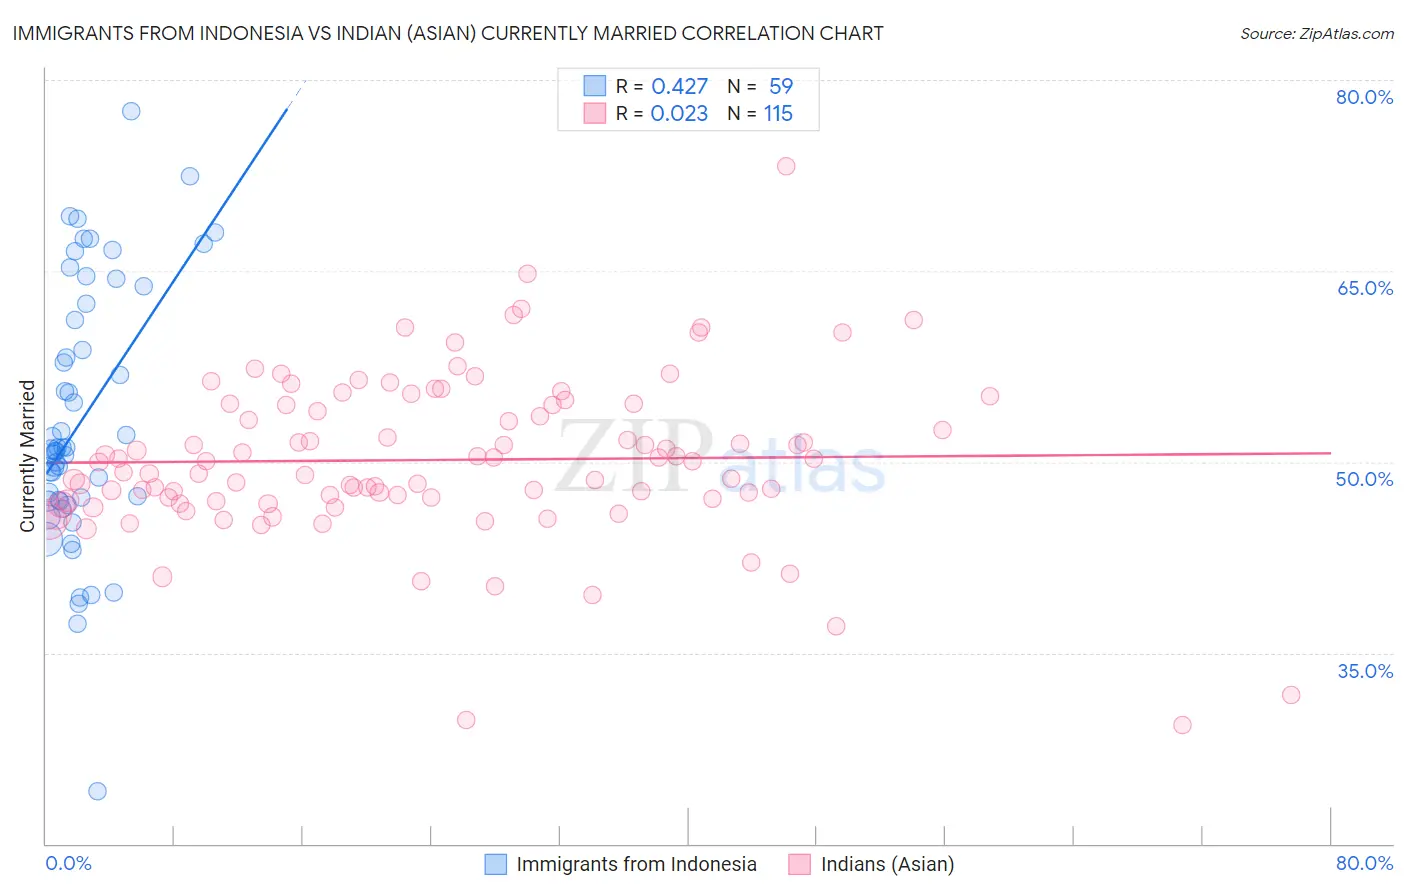
Immigrants from Indonesia vs Indian (Asian) Currently Married Correlation Chart
The statistical analysis conducted on geographies consisting of 215,768,024 people shows a moderate positive correlation between the proportion of Immigrants from Indonesia and percentage of population currently married in the United States with a correlation coefficient (R) of 0.427 and weighted average of 47.6%. Similarly, the statistical analysis conducted on geographies consisting of 495,221,745 people shows no correlation between the proportion of Indians (Asian) and percentage of population currently married in the United States with a correlation coefficient (R) of 0.023 and weighted average of 48.0%, a difference of 0.78%.
Currently Married Correlation Summary
| Measurement | Immigrants from Indonesia | Indian (Asian) |
| Minimum | 24.1% | 29.3% |
| Maximum | 77.5% | 73.2% |
| Range | 53.4% | 43.9% |
| Mean | 53.3% | 50.1% |
| Median | 51.0% | 50.0% |
| Interquartile 25% (IQ1) | 46.9% | 46.9% |
| Interquartile 75% (IQ3) | 62.4% | 54.5% |
| Interquartile Range (IQR) | 15.5% | 7.5% |
| Standard Deviation (Sample) | 10.3% | 6.5% |
| Standard Deviation (Population) | 10.2% | 6.4% |
Similar Demographics by Currently Married
Demographics Similar to Immigrants from Indonesia by Currently Married
In terms of currently married, the demographic groups most similar to Immigrants from Indonesia are South African (47.6%, a difference of 0.0%), Palestinian (47.6%, a difference of 0.010%), Puget Sound Salish (47.6%, a difference of 0.020%), Immigrants from Philippines (47.6%, a difference of 0.030%), and Australian (47.6%, a difference of 0.030%).
| Demographics | Rating | Rank | Currently Married |
| Tsimshian | 92.4 /100 | #108 | Exceptional 47.7% |
| Immigrants | Egypt | 92.3 /100 | #109 | Exceptional 47.7% |
| Immigrants | Russia | 92.0 /100 | #110 | Exceptional 47.7% |
| Immigrants | Hungary | 91.2 /100 | #111 | Exceptional 47.6% |
| Immigrants | Western Europe | 91.1 /100 | #112 | Exceptional 47.6% |
| Immigrants | Denmark | 90.9 /100 | #113 | Exceptional 47.6% |
| South Africans | 90.5 /100 | #114 | Exceptional 47.6% |
| Immigrants | Indonesia | 90.5 /100 | #115 | Exceptional 47.6% |
| Palestinians | 90.4 /100 | #116 | Exceptional 47.6% |
| Puget Sound Salish | 90.3 /100 | #117 | Exceptional 47.6% |
| Immigrants | Philippines | 90.2 /100 | #118 | Exceptional 47.6% |
| Australians | 90.2 /100 | #119 | Exceptional 47.6% |
| Syrians | 88.9 /100 | #120 | Excellent 47.5% |
| Immigrants | Croatia | 88.6 /100 | #121 | Excellent 47.5% |
| Osage | 87.9 /100 | #122 | Excellent 47.5% |
Demographics Similar to Indians (Asian) by Currently Married
In terms of currently married, the demographic groups most similar to Indians (Asian) are American (48.0%, a difference of 0.020%), Immigrants from Bolivia (47.9%, a difference of 0.050%), Immigrants from Eastern Europe (48.0%, a difference of 0.060%), Jordanian (48.0%, a difference of 0.080%), and Immigrants from Japan (48.0%, a difference of 0.090%).
| Demographics | Rating | Rank | Currently Married |
| Immigrants | Europe | 96.9 /100 | #82 | Exceptional 48.1% |
| Bolivians | 96.9 /100 | #83 | Exceptional 48.1% |
| Immigrants | Israel | 96.9 /100 | #84 | Exceptional 48.1% |
| French Canadians | 96.3 /100 | #85 | Exceptional 48.0% |
| Immigrants | Japan | 96.2 /100 | #86 | Exceptional 48.0% |
| Jordanians | 96.2 /100 | #87 | Exceptional 48.0% |
| Immigrants | Eastern Europe | 96.1 /100 | #88 | Exceptional 48.0% |
| Indians (Asian) | 95.8 /100 | #89 | Exceptional 48.0% |
| Americans | 95.7 /100 | #90 | Exceptional 48.0% |
| Immigrants | Bolivia | 95.6 /100 | #91 | Exceptional 47.9% |
| Koreans | 95.4 /100 | #92 | Exceptional 47.9% |
| Lebanese | 95.1 /100 | #93 | Exceptional 47.9% |
| Native Hawaiians | 95.0 /100 | #94 | Exceptional 47.9% |
| Immigrants | Bulgaria | 94.8 /100 | #95 | Exceptional 47.9% |
| Egyptians | 94.8 /100 | #96 | Exceptional 47.9% |