Canadian vs Immigrants from Grenada Currently Married
COMPARE
Canadian
Immigrants from Grenada
Currently Married
Currently Married Comparison
Canadians
Immigrants from Grenada
48.3%
CURRENTLY MARRIED
98.1/ 100
METRIC RATING
69th/ 347
METRIC RANK
39.1%
CURRENTLY MARRIED
0.0/ 100
METRIC RATING
340th/ 347
METRIC RANK
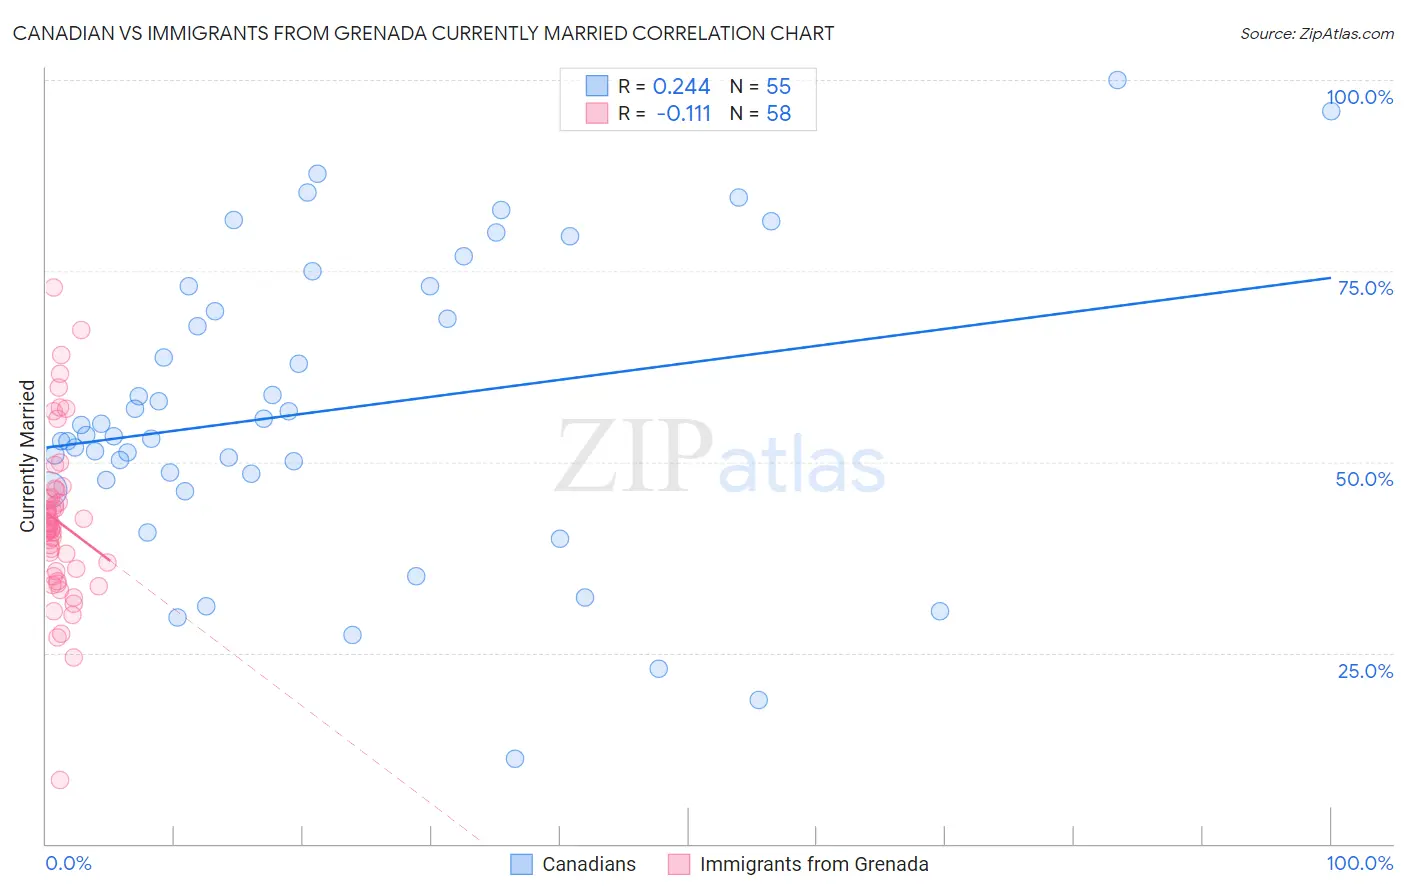
Canadian vs Immigrants from Grenada Currently Married Correlation Chart
The statistical analysis conducted on geographies consisting of 437,507,905 people shows a weak positive correlation between the proportion of Canadians and percentage of population currently married in the United States with a correlation coefficient (R) of 0.244 and weighted average of 48.3%. Similarly, the statistical analysis conducted on geographies consisting of 67,201,096 people shows a poor negative correlation between the proportion of Immigrants from Grenada and percentage of population currently married in the United States with a correlation coefficient (R) of -0.111 and weighted average of 39.1%, a difference of 23.4%.
Currently Married Correlation Summary
| Measurement | Canadian | Immigrants from Grenada |
| Minimum | 11.1% | 8.3% |
| Maximum | 100.0% | 72.8% |
| Range | 88.9% | 64.5% |
| Mean | 56.8% | 42.2% |
| Median | 53.5% | 41.4% |
| Interquartile 25% (IQ1) | 47.6% | 35.6% |
| Interquartile 75% (IQ3) | 73.0% | 45.4% |
| Interquartile Range (IQR) | 25.3% | 9.8% |
| Standard Deviation (Sample) | 19.6% | 10.9% |
| Standard Deviation (Population) | 19.4% | 10.8% |
Similar Demographics by Currently Married
Demographics Similar to Canadians by Currently Married
In terms of currently married, the demographic groups most similar to Canadians are Slovak (48.3%, a difference of 0.020%), Immigrants from England (48.3%, a difference of 0.020%), Tongan (48.3%, a difference of 0.040%), Immigrants from Czechoslovakia (48.4%, a difference of 0.070%), and Ukrainian (48.4%, a difference of 0.070%).
| Demographics | Rating | Rank | Currently Married |
| Asians | 98.5 /100 | #62 | Exceptional 48.4% |
| Slavs | 98.3 /100 | #63 | Exceptional 48.4% |
| Immigrants | Czechoslovakia | 98.3 /100 | #64 | Exceptional 48.4% |
| Ukrainians | 98.3 /100 | #65 | Exceptional 48.4% |
| Tongans | 98.2 /100 | #66 | Exceptional 48.3% |
| Slovaks | 98.2 /100 | #67 | Exceptional 48.3% |
| Immigrants | England | 98.2 /100 | #68 | Exceptional 48.3% |
| Canadians | 98.1 /100 | #69 | Exceptional 48.3% |
| Immigrants | Asia | 97.9 /100 | #70 | Exceptional 48.3% |
| Macedonians | 97.9 /100 | #71 | Exceptional 48.3% |
| Immigrants | Lebanon | 97.6 /100 | #72 | Exceptional 48.2% |
| Immigrants | Eastern Asia | 97.5 /100 | #73 | Exceptional 48.2% |
| Estonians | 97.4 /100 | #74 | Exceptional 48.2% |
| Immigrants | Belarus | 97.2 /100 | #75 | Exceptional 48.1% |
| Basques | 97.2 /100 | #76 | Exceptional 48.1% |
Demographics Similar to Immigrants from Grenada by Currently Married
In terms of currently married, the demographic groups most similar to Immigrants from Grenada are Navajo (39.0%, a difference of 0.35%), Immigrants from Dominican Republic (38.9%, a difference of 0.52%), Dominican (39.5%, a difference of 0.96%), Cape Verdean (39.6%, a difference of 1.1%), and Black/African American (39.6%, a difference of 1.2%).
| Demographics | Rating | Rank | Currently Married |
| Yup'ik | 0.0 /100 | #333 | Tragic 39.9% |
| Puerto Ricans | 0.0 /100 | #334 | Tragic 39.9% |
| Lumbee | 0.0 /100 | #335 | Tragic 39.8% |
| British West Indians | 0.0 /100 | #336 | Tragic 39.8% |
| Blacks/African Americans | 0.0 /100 | #337 | Tragic 39.6% |
| Cape Verdeans | 0.0 /100 | #338 | Tragic 39.6% |
| Dominicans | 0.0 /100 | #339 | Tragic 39.5% |
| Immigrants | Grenada | 0.0 /100 | #340 | Tragic 39.1% |
| Navajo | 0.0 /100 | #341 | Tragic 39.0% |
| Immigrants | Dominican Republic | 0.0 /100 | #342 | Tragic 38.9% |
| Pueblo | 0.0 /100 | #343 | Tragic 38.2% |
| Immigrants | Cabo Verde | 0.0 /100 | #344 | Tragic 37.8% |
| Tohono O'odham | 0.0 /100 | #345 | Tragic 36.8% |
| Hopi | 0.0 /100 | #346 | Tragic 36.5% |
| Pima | 0.0 /100 | #347 | Tragic 35.9% |