Immigrants from Greece vs Indian (Asian) Currently Married
COMPARE
Immigrants from Greece
Indian (Asian)
Currently Married
Currently Married Comparison
Immigrants from Greece
Indians (Asian)
47.7%
CURRENTLY MARRIED
93.1/ 100
METRIC RATING
106th/ 347
METRIC RANK
48.0%
CURRENTLY MARRIED
95.8/ 100
METRIC RATING
89th/ 347
METRIC RANK
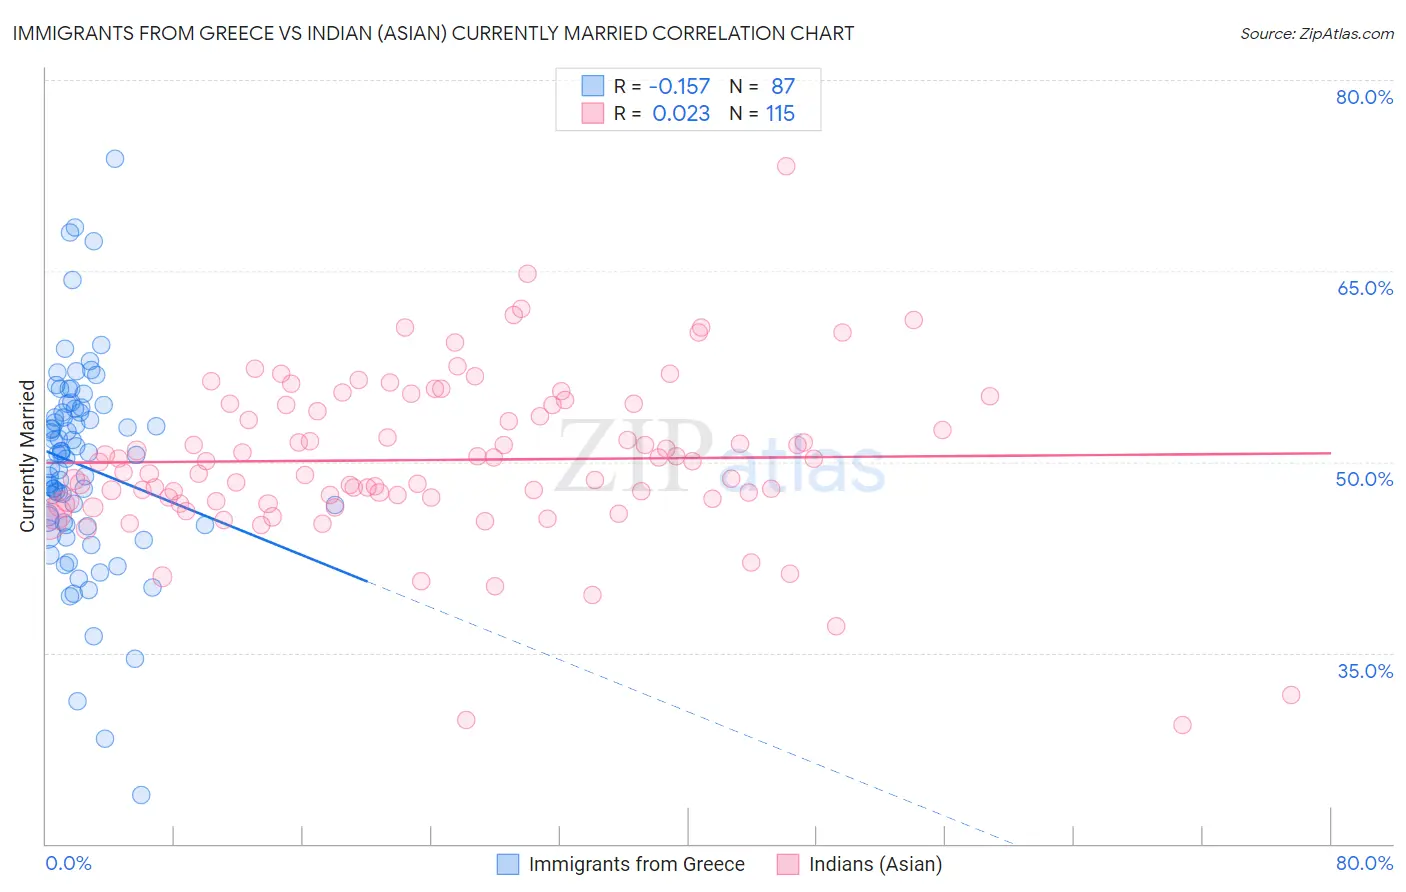
Immigrants from Greece vs Indian (Asian) Currently Married Correlation Chart
The statistical analysis conducted on geographies consisting of 216,874,138 people shows a poor negative correlation between the proportion of Immigrants from Greece and percentage of population currently married in the United States with a correlation coefficient (R) of -0.157 and weighted average of 47.7%. Similarly, the statistical analysis conducted on geographies consisting of 495,221,745 people shows no correlation between the proportion of Indians (Asian) and percentage of population currently married in the United States with a correlation coefficient (R) of 0.023 and weighted average of 48.0%, a difference of 0.47%.
Currently Married Correlation Summary
| Measurement | Immigrants from Greece | Indian (Asian) |
| Minimum | 23.8% | 29.3% |
| Maximum | 73.8% | 73.2% |
| Range | 50.0% | 43.9% |
| Mean | 49.7% | 50.1% |
| Median | 50.6% | 50.0% |
| Interquartile 25% (IQ1) | 45.0% | 46.9% |
| Interquartile 75% (IQ3) | 54.2% | 54.5% |
| Interquartile Range (IQR) | 9.1% | 7.5% |
| Standard Deviation (Sample) | 8.1% | 6.5% |
| Standard Deviation (Population) | 8.1% | 6.4% |
Demographics Similar to Immigrants from Greece and Indians (Asian) by Currently Married
In terms of currently married, the demographic groups most similar to Immigrants from Greece are Immigrants from Singapore (47.8%, a difference of 0.030%), Immigrants from Italy (47.7%, a difference of 0.030%), Serbian (47.8%, a difference of 0.080%), Cypriot (47.8%, a difference of 0.090%), and Turkish (47.8%, a difference of 0.12%). Similarly, the demographic groups most similar to Indians (Asian) are American (48.0%, a difference of 0.020%), Immigrants from Bolivia (47.9%, a difference of 0.050%), Immigrants from Eastern Europe (48.0%, a difference of 0.060%), Jordanian (48.0%, a difference of 0.080%), and Korean (47.9%, a difference of 0.090%).
| Demographics | Rating | Rank | Currently Married |
| Jordanians | 96.2 /100 | #87 | Exceptional 48.0% |
| Immigrants | Eastern Europe | 96.1 /100 | #88 | Exceptional 48.0% |
| Indians (Asian) | 95.8 /100 | #89 | Exceptional 48.0% |
| Americans | 95.7 /100 | #90 | Exceptional 48.0% |
| Immigrants | Bolivia | 95.6 /100 | #91 | Exceptional 47.9% |
| Koreans | 95.4 /100 | #92 | Exceptional 47.9% |
| Lebanese | 95.1 /100 | #93 | Exceptional 47.9% |
| Native Hawaiians | 95.0 /100 | #94 | Exceptional 47.9% |
| Immigrants | Bulgaria | 94.8 /100 | #95 | Exceptional 47.9% |
| Egyptians | 94.8 /100 | #96 | Exceptional 47.9% |
| Immigrants | Ukraine | 94.8 /100 | #97 | Exceptional 47.9% |
| Immigrants | China | 94.7 /100 | #98 | Exceptional 47.9% |
| Immigrants | Sweden | 94.3 /100 | #99 | Exceptional 47.8% |
| Celtics | 94.2 /100 | #100 | Exceptional 47.8% |
| Immigrants | Germany | 94.1 /100 | #101 | Exceptional 47.8% |
| Turks | 93.9 /100 | #102 | Exceptional 47.8% |
| Cypriots | 93.7 /100 | #103 | Exceptional 47.8% |
| Serbians | 93.6 /100 | #104 | Exceptional 47.8% |
| Immigrants | Singapore | 93.3 /100 | #105 | Exceptional 47.8% |
| Immigrants | Greece | 93.1 /100 | #106 | Exceptional 47.7% |
| Immigrants | Italy | 92.9 /100 | #107 | Exceptional 47.7% |