Cambodian vs Macedonian Single Father Households
COMPARE
Cambodian
Macedonian
Single Father Households
Single Father Households Comparison
Cambodians
Macedonians
2.0%
SINGLE FATHER HOUSEHOLDS
100.0/ 100
METRIC RATING
30th/ 347
METRIC RANK
2.0%
SINGLE FATHER HOUSEHOLDS
100.0/ 100
METRIC RATING
42nd/ 347
METRIC RANK
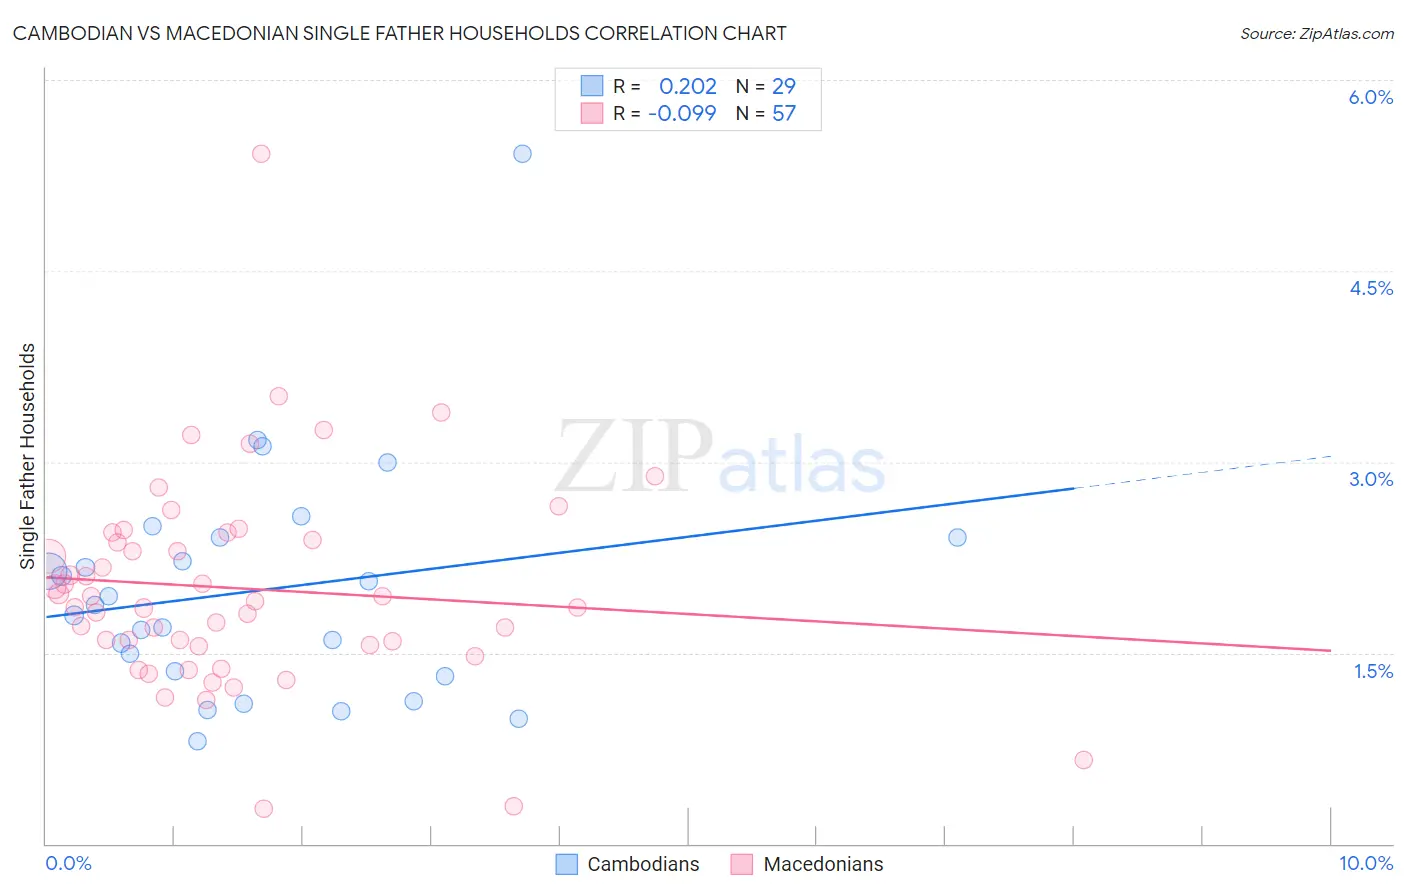
Cambodian vs Macedonian Single Father Households Correlation Chart
The statistical analysis conducted on geographies consisting of 102,339,342 people shows a weak positive correlation between the proportion of Cambodians and percentage of single father households in the United States with a correlation coefficient (R) of 0.202 and weighted average of 2.0%. Similarly, the statistical analysis conducted on geographies consisting of 132,178,370 people shows a slight negative correlation between the proportion of Macedonians and percentage of single father households in the United States with a correlation coefficient (R) of -0.099 and weighted average of 2.0%, a difference of 1.4%.
Single Father Households Correlation Summary
| Measurement | Cambodian | Macedonian |
| Minimum | 0.80% | 0.27% |
| Maximum | 5.4% | 5.4% |
| Range | 4.6% | 5.1% |
| Mean | 2.0% | 2.0% |
| Median | 1.9% | 1.9% |
| Interquartile 25% (IQ1) | 1.3% | 1.6% |
| Interquartile 75% (IQ3) | 2.4% | 2.4% |
| Interquartile Range (IQR) | 1.1% | 0.86% |
| Standard Deviation (Sample) | 0.92% | 0.83% |
| Standard Deviation (Population) | 0.91% | 0.82% |
Demographics Similar to Cambodians and Macedonians by Single Father Households
In terms of single father households, the demographic groups most similar to Cambodians are Bulgarian (2.0%, a difference of 0.020%), Israeli (2.0%, a difference of 0.030%), Chinese (2.0%, a difference of 0.070%), Immigrants from Japan (2.0%, a difference of 0.11%), and Turkish (2.0%, a difference of 0.28%). Similarly, the demographic groups most similar to Macedonians are Immigrants from Turkey (2.0%, a difference of 0.15%), Immigrants from Grenada (2.0%, a difference of 0.23%), Latvian (2.0%, a difference of 0.31%), Immigrants from Bulgaria (2.0%, a difference of 0.33%), and Russian (2.0%, a difference of 0.33%).
| Demographics | Rating | Rank | Single Father Households |
| Assyrians/Chaldeans/Syriacs | 100.0 /100 | #26 | Exceptional 2.0% |
| Immigrants | South Central Asia | 100.0 /100 | #27 | Exceptional 2.0% |
| Immigrants | Japan | 100.0 /100 | #28 | Exceptional 2.0% |
| Bulgarians | 100.0 /100 | #29 | Exceptional 2.0% |
| Cambodians | 100.0 /100 | #30 | Exceptional 2.0% |
| Israelis | 100.0 /100 | #31 | Exceptional 2.0% |
| Chinese | 100.0 /100 | #32 | Exceptional 2.0% |
| Turks | 100.0 /100 | #33 | Exceptional 2.0% |
| Immigrants | Australia | 100.0 /100 | #34 | Exceptional 2.0% |
| Albanians | 100.0 /100 | #35 | Exceptional 2.0% |
| Immigrants | Belgium | 100.0 /100 | #36 | Exceptional 2.0% |
| Immigrants | St. Vincent and the Grenadines | 100.0 /100 | #37 | Exceptional 2.0% |
| Immigrants | Eastern Europe | 100.0 /100 | #38 | Exceptional 2.0% |
| Immigrants | Sri Lanka | 100.0 /100 | #39 | Exceptional 2.0% |
| Immigrants | Bulgaria | 100.0 /100 | #40 | Exceptional 2.0% |
| Immigrants | Turkey | 100.0 /100 | #41 | Exceptional 2.0% |
| Macedonians | 100.0 /100 | #42 | Exceptional 2.0% |
| Immigrants | Grenada | 100.0 /100 | #43 | Exceptional 2.0% |
| Latvians | 100.0 /100 | #44 | Exceptional 2.0% |
| Russians | 100.0 /100 | #45 | Exceptional 2.0% |
| Immigrants | Lebanon | 100.0 /100 | #46 | Exceptional 2.0% |