Cambodian vs Immigrants from Lithuania Single Father Households
COMPARE
Cambodian
Immigrants from Lithuania
Single Father Households
Single Father Households Comparison
Cambodians
Immigrants from Lithuania
2.0%
SINGLE FATHER HOUSEHOLDS
100.0/ 100
METRIC RATING
30th/ 347
METRIC RANK
1.9%
SINGLE FATHER HOUSEHOLDS
100.0/ 100
METRIC RATING
14th/ 347
METRIC RANK
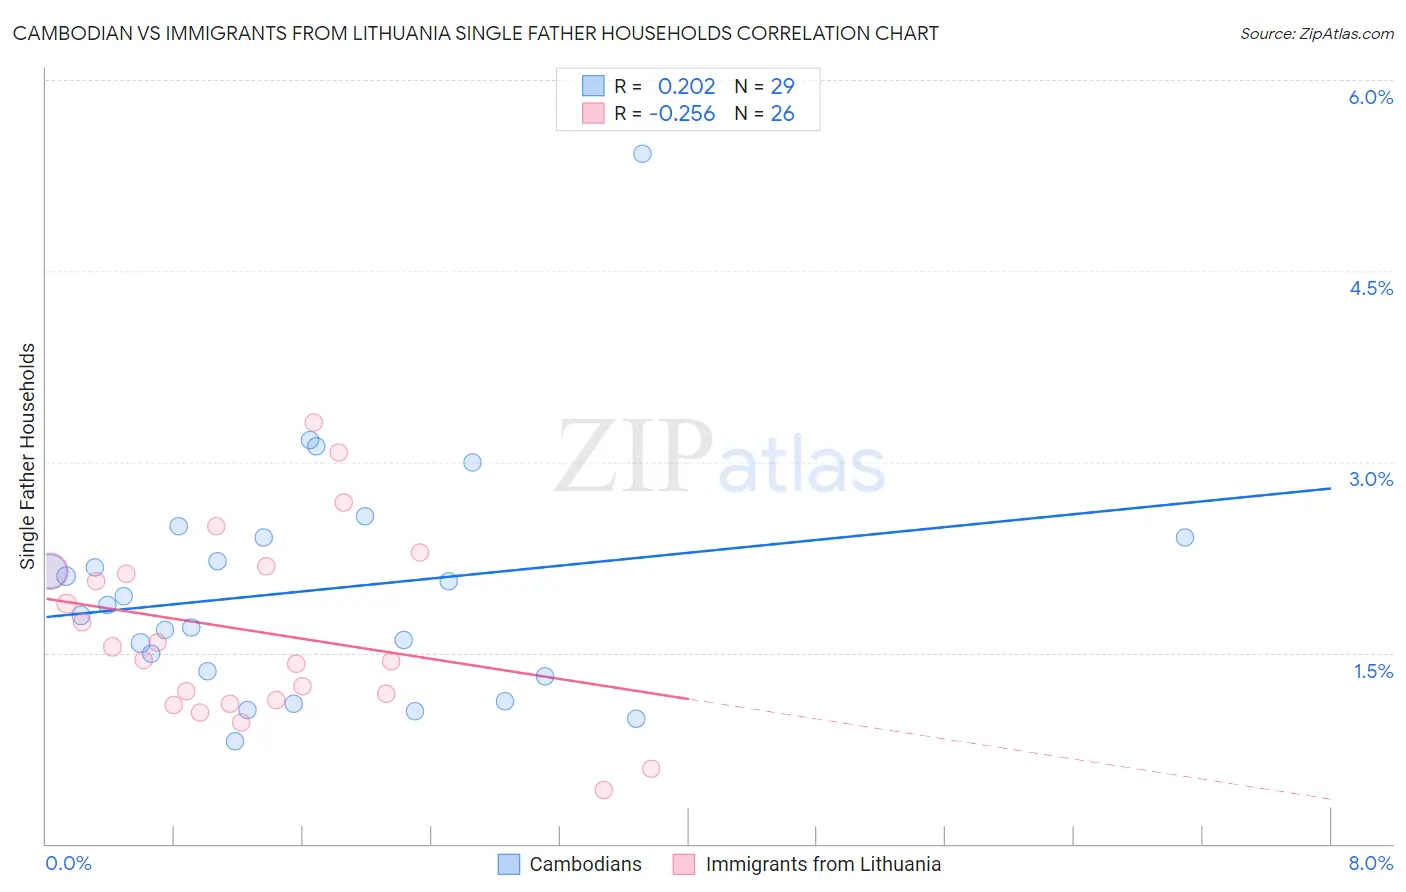
Cambodian vs Immigrants from Lithuania Single Father Households Correlation Chart
The statistical analysis conducted on geographies consisting of 102,339,342 people shows a weak positive correlation between the proportion of Cambodians and percentage of single father households in the United States with a correlation coefficient (R) of 0.202 and weighted average of 2.0%. Similarly, the statistical analysis conducted on geographies consisting of 117,396,779 people shows a weak negative correlation between the proportion of Immigrants from Lithuania and percentage of single father households in the United States with a correlation coefficient (R) of -0.256 and weighted average of 1.9%, a difference of 4.5%.
Single Father Households Correlation Summary
| Measurement | Cambodian | Immigrants from Lithuania |
| Minimum | 0.80% | 0.43% |
| Maximum | 5.4% | 3.3% |
| Range | 4.6% | 2.9% |
| Mean | 2.0% | 1.7% |
| Median | 1.9% | 1.5% |
| Interquartile 25% (IQ1) | 1.3% | 1.1% |
| Interquartile 75% (IQ3) | 2.4% | 2.1% |
| Interquartile Range (IQR) | 1.1% | 1.0% |
| Standard Deviation (Sample) | 0.92% | 0.72% |
| Standard Deviation (Population) | 0.91% | 0.71% |
Demographics Similar to Cambodians and Immigrants from Lithuania by Single Father Households
In terms of single father households, the demographic groups most similar to Cambodians are Bulgarian (2.0%, a difference of 0.020%), Israeli (2.0%, a difference of 0.030%), Chinese (2.0%, a difference of 0.070%), Immigrants from Japan (2.0%, a difference of 0.11%), and Immigrants from South Central Asia (2.0%, a difference of 0.29%). Similarly, the demographic groups most similar to Immigrants from Lithuania are Immigrants from Eastern Asia (1.9%, a difference of 0.15%), Immigrants from Iran (1.9%, a difference of 0.35%), Immigrants from India (1.9%, a difference of 0.58%), Immigrants from Singapore (1.9%, a difference of 0.98%), and Immigrants from Greece (1.9%, a difference of 1.0%).
| Demographics | Rating | Rank | Single Father Households |
| Immigrants | Greece | 100.0 /100 | #12 | Exceptional 1.9% |
| Immigrants | Singapore | 100.0 /100 | #13 | Exceptional 1.9% |
| Immigrants | Lithuania | 100.0 /100 | #14 | Exceptional 1.9% |
| Immigrants | Eastern Asia | 100.0 /100 | #15 | Exceptional 1.9% |
| Immigrants | Iran | 100.0 /100 | #16 | Exceptional 1.9% |
| Immigrants | India | 100.0 /100 | #17 | Exceptional 1.9% |
| Indians (Asian) | 100.0 /100 | #18 | Exceptional 1.9% |
| Iranians | 100.0 /100 | #19 | Exceptional 1.9% |
| Thais | 100.0 /100 | #20 | Exceptional 1.9% |
| Immigrants | Albania | 100.0 /100 | #21 | Exceptional 1.9% |
| Immigrants | Latvia | 100.0 /100 | #22 | Exceptional 1.9% |
| Immigrants | Croatia | 100.0 /100 | #23 | Exceptional 2.0% |
| Immigrants | Russia | 100.0 /100 | #24 | Exceptional 2.0% |
| Eastern Europeans | 100.0 /100 | #25 | Exceptional 2.0% |
| Assyrians/Chaldeans/Syriacs | 100.0 /100 | #26 | Exceptional 2.0% |
| Immigrants | South Central Asia | 100.0 /100 | #27 | Exceptional 2.0% |
| Immigrants | Japan | 100.0 /100 | #28 | Exceptional 2.0% |
| Bulgarians | 100.0 /100 | #29 | Exceptional 2.0% |
| Cambodians | 100.0 /100 | #30 | Exceptional 2.0% |
| Israelis | 100.0 /100 | #31 | Exceptional 2.0% |
| Chinese | 100.0 /100 | #32 | Exceptional 2.0% |