Immigrants from Bulgaria vs Macedonian Single Father Households
COMPARE
Immigrants from Bulgaria
Macedonian
Single Father Households
Single Father Households Comparison
Immigrants from Bulgaria
Macedonians
2.0%
SINGLE FATHER HOUSEHOLDS
100.0/ 100
METRIC RATING
40th/ 347
METRIC RANK
2.0%
SINGLE FATHER HOUSEHOLDS
100.0/ 100
METRIC RATING
42nd/ 347
METRIC RANK
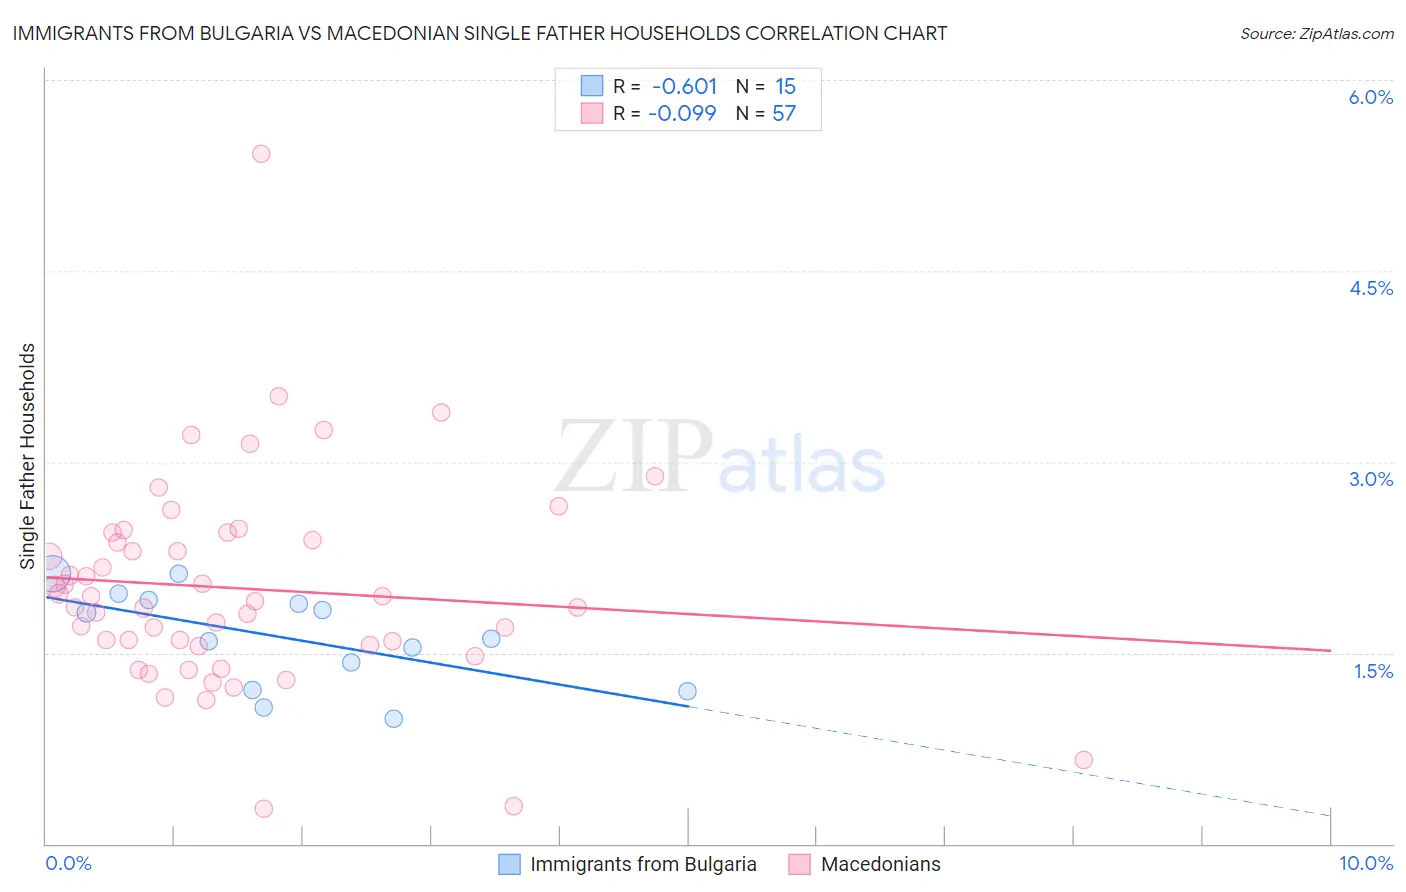
Immigrants from Bulgaria vs Macedonian Single Father Households Correlation Chart
The statistical analysis conducted on geographies consisting of 172,048,357 people shows a significant negative correlation between the proportion of Immigrants from Bulgaria and percentage of single father households in the United States with a correlation coefficient (R) of -0.601 and weighted average of 2.0%. Similarly, the statistical analysis conducted on geographies consisting of 132,178,370 people shows a slight negative correlation between the proportion of Macedonians and percentage of single father households in the United States with a correlation coefficient (R) of -0.099 and weighted average of 2.0%, a difference of 0.33%.
Single Father Households Correlation Summary
| Measurement | Immigrants from Bulgaria | Macedonian |
| Minimum | 0.98% | 0.27% |
| Maximum | 2.1% | 5.4% |
| Range | 1.1% | 5.1% |
| Mean | 1.6% | 2.0% |
| Median | 1.6% | 1.9% |
| Interquartile 25% (IQ1) | 1.2% | 1.6% |
| Interquartile 75% (IQ3) | 1.9% | 2.4% |
| Interquartile Range (IQR) | 0.70% | 0.86% |
| Standard Deviation (Sample) | 0.37% | 0.83% |
| Standard Deviation (Population) | 0.36% | 0.82% |
Demographics Similar to Immigrants from Bulgaria and Macedonians by Single Father Households
In terms of single father households, the demographic groups most similar to Immigrants from Bulgaria are Immigrants from Eastern Europe (2.0%, a difference of 0.050%), Immigrants from Sri Lanka (2.0%, a difference of 0.050%), Immigrants from Turkey (2.0%, a difference of 0.18%), Immigrants from St. Vincent and the Grenadines (2.0%, a difference of 0.35%), and Immigrants from Belgium (2.0%, a difference of 0.37%). Similarly, the demographic groups most similar to Macedonians are Immigrants from Turkey (2.0%, a difference of 0.15%), Immigrants from Grenada (2.0%, a difference of 0.23%), Latvian (2.0%, a difference of 0.31%), Russian (2.0%, a difference of 0.33%), and Immigrants from Eastern Europe (2.0%, a difference of 0.38%).
| Demographics | Rating | Rank | Single Father Households |
| Israelis | 100.0 /100 | #31 | Exceptional 2.0% |
| Chinese | 100.0 /100 | #32 | Exceptional 2.0% |
| Turks | 100.0 /100 | #33 | Exceptional 2.0% |
| Immigrants | Australia | 100.0 /100 | #34 | Exceptional 2.0% |
| Albanians | 100.0 /100 | #35 | Exceptional 2.0% |
| Immigrants | Belgium | 100.0 /100 | #36 | Exceptional 2.0% |
| Immigrants | St. Vincent and the Grenadines | 100.0 /100 | #37 | Exceptional 2.0% |
| Immigrants | Eastern Europe | 100.0 /100 | #38 | Exceptional 2.0% |
| Immigrants | Sri Lanka | 100.0 /100 | #39 | Exceptional 2.0% |
| Immigrants | Bulgaria | 100.0 /100 | #40 | Exceptional 2.0% |
| Immigrants | Turkey | 100.0 /100 | #41 | Exceptional 2.0% |
| Macedonians | 100.0 /100 | #42 | Exceptional 2.0% |
| Immigrants | Grenada | 100.0 /100 | #43 | Exceptional 2.0% |
| Latvians | 100.0 /100 | #44 | Exceptional 2.0% |
| Russians | 100.0 /100 | #45 | Exceptional 2.0% |
| Immigrants | Lebanon | 100.0 /100 | #46 | Exceptional 2.0% |
| Immigrants | Ukraine | 99.9 /100 | #47 | Exceptional 2.0% |
| Immigrants | Kazakhstan | 99.9 /100 | #48 | Exceptional 2.0% |
| Immigrants | Serbia | 99.9 /100 | #49 | Exceptional 2.0% |
| Immigrants | Switzerland | 99.9 /100 | #50 | Exceptional 2.0% |
| Immigrants | Poland | 99.9 /100 | #51 | Exceptional 2.0% |