Cambodian vs Immigrants from Uruguay Single Father Households
COMPARE
Cambodian
Immigrants from Uruguay
Single Father Households
Single Father Households Comparison
Cambodians
Immigrants from Uruguay
2.0%
SINGLE FATHER HOUSEHOLDS
100.0/ 100
METRIC RATING
30th/ 347
METRIC RANK
2.4%
SINGLE FATHER HOUSEHOLDS
11.0/ 100
METRIC RATING
223rd/ 347
METRIC RANK
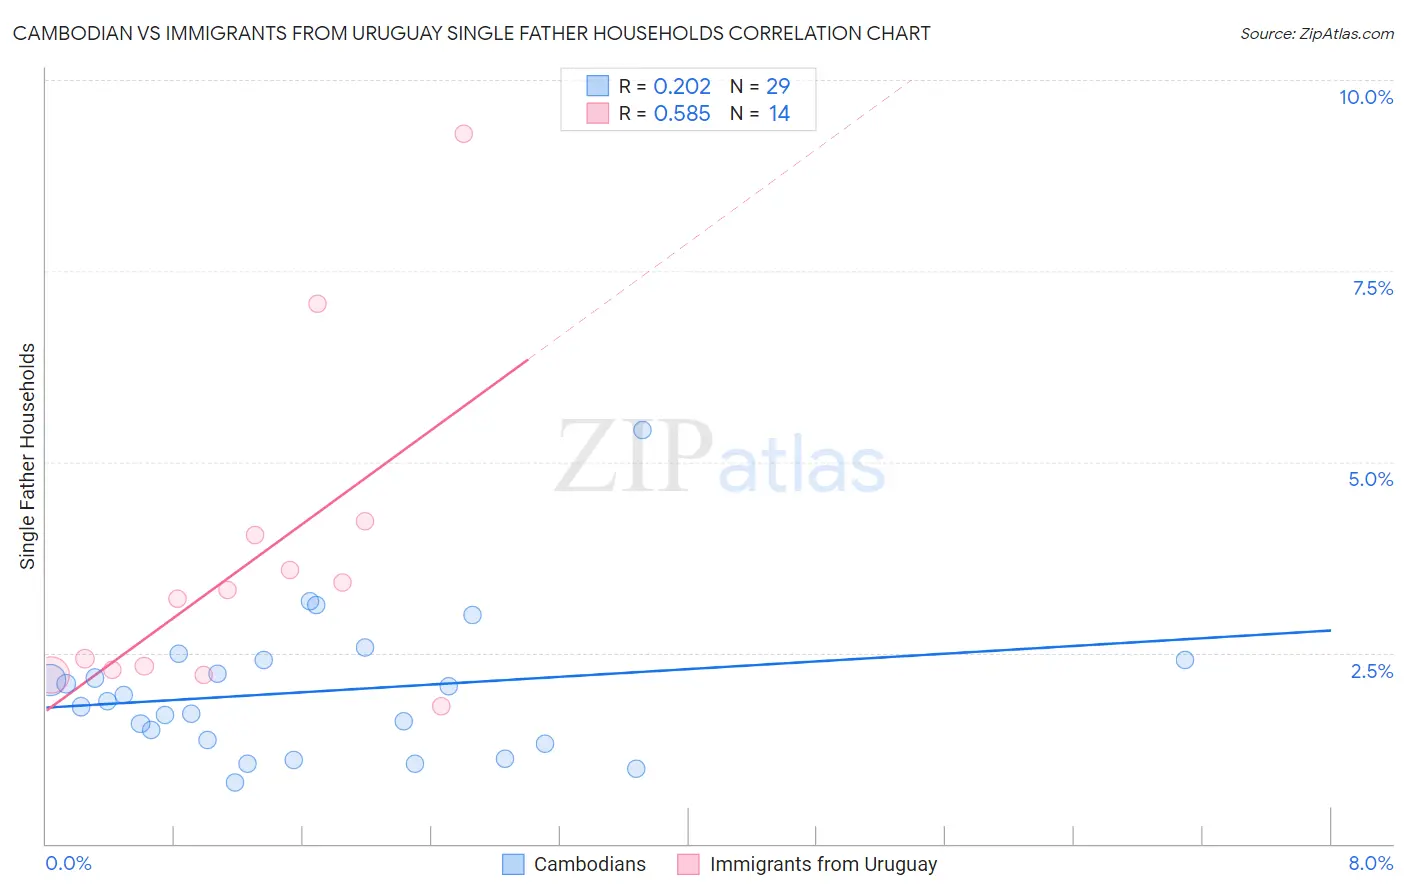
Cambodian vs Immigrants from Uruguay Single Father Households Correlation Chart
The statistical analysis conducted on geographies consisting of 102,339,342 people shows a weak positive correlation between the proportion of Cambodians and percentage of single father households in the United States with a correlation coefficient (R) of 0.202 and weighted average of 2.0%. Similarly, the statistical analysis conducted on geographies consisting of 132,991,914 people shows a substantial positive correlation between the proportion of Immigrants from Uruguay and percentage of single father households in the United States with a correlation coefficient (R) of 0.585 and weighted average of 2.4%, a difference of 23.2%.
Single Father Households Correlation Summary
| Measurement | Cambodian | Immigrants from Uruguay |
| Minimum | 0.80% | 1.8% |
| Maximum | 5.4% | 9.3% |
| Range | 4.6% | 7.5% |
| Mean | 2.0% | 3.7% |
| Median | 1.9% | 3.3% |
| Interquartile 25% (IQ1) | 1.3% | 2.3% |
| Interquartile 75% (IQ3) | 2.4% | 4.0% |
| Interquartile Range (IQR) | 1.1% | 1.8% |
| Standard Deviation (Sample) | 0.92% | 2.1% |
| Standard Deviation (Population) | 0.91% | 2.0% |
Similar Demographics by Single Father Households
Demographics Similar to Cambodians by Single Father Households
In terms of single father households, the demographic groups most similar to Cambodians are Bulgarian (2.0%, a difference of 0.020%), Israeli (2.0%, a difference of 0.030%), Chinese (2.0%, a difference of 0.070%), Immigrants from Japan (2.0%, a difference of 0.11%), and Turkish (2.0%, a difference of 0.28%).
| Demographics | Rating | Rank | Single Father Households |
| Immigrants | Croatia | 100.0 /100 | #23 | Exceptional 2.0% |
| Immigrants | Russia | 100.0 /100 | #24 | Exceptional 2.0% |
| Eastern Europeans | 100.0 /100 | #25 | Exceptional 2.0% |
| Assyrians/Chaldeans/Syriacs | 100.0 /100 | #26 | Exceptional 2.0% |
| Immigrants | South Central Asia | 100.0 /100 | #27 | Exceptional 2.0% |
| Immigrants | Japan | 100.0 /100 | #28 | Exceptional 2.0% |
| Bulgarians | 100.0 /100 | #29 | Exceptional 2.0% |
| Cambodians | 100.0 /100 | #30 | Exceptional 2.0% |
| Israelis | 100.0 /100 | #31 | Exceptional 2.0% |
| Chinese | 100.0 /100 | #32 | Exceptional 2.0% |
| Turks | 100.0 /100 | #33 | Exceptional 2.0% |
| Immigrants | Australia | 100.0 /100 | #34 | Exceptional 2.0% |
| Albanians | 100.0 /100 | #35 | Exceptional 2.0% |
| Immigrants | Belgium | 100.0 /100 | #36 | Exceptional 2.0% |
| Immigrants | St. Vincent and the Grenadines | 100.0 /100 | #37 | Exceptional 2.0% |
Demographics Similar to Immigrants from Uruguay by Single Father Households
In terms of single father households, the demographic groups most similar to Immigrants from Uruguay are Immigrants from Bahamas (2.4%, a difference of 0.070%), Immigrants from Eastern Africa (2.4%, a difference of 0.16%), Immigrants from Burma/Myanmar (2.4%, a difference of 0.19%), Marshallese (2.4%, a difference of 0.25%), and Black/African American (2.4%, a difference of 0.26%).
| Demographics | Rating | Rank | Single Father Households |
| Immigrants | Ecuador | 14.9 /100 | #216 | Poor 2.4% |
| Dutch | 14.3 /100 | #217 | Poor 2.4% |
| Immigrants | Ethiopia | 13.4 /100 | #218 | Poor 2.4% |
| Sudanese | 13.0 /100 | #219 | Poor 2.4% |
| Ghanaians | 12.9 /100 | #220 | Poor 2.4% |
| Immigrants | Burma/Myanmar | 12.1 /100 | #221 | Poor 2.4% |
| Immigrants | Eastern Africa | 11.9 /100 | #222 | Poor 2.4% |
| Immigrants | Uruguay | 11.0 /100 | #223 | Poor 2.4% |
| Immigrants | Bahamas | 10.6 /100 | #224 | Poor 2.4% |
| Marshallese | 9.7 /100 | #225 | Tragic 2.4% |
| Blacks/African Americans | 9.7 /100 | #226 | Tragic 2.4% |
| Americans | 9.3 /100 | #227 | Tragic 2.4% |
| Immigrants | Ghana | 9.1 /100 | #228 | Tragic 2.4% |
| Immigrants | Zaire | 8.6 /100 | #229 | Tragic 2.4% |
| Sub-Saharan Africans | 8.3 /100 | #230 | Tragic 2.4% |