Cambodian vs Macedonian Seniors Poverty Over the Age of 65
COMPARE
Cambodian
Macedonian
Seniors Poverty Over the Age of 65
Seniors Poverty Over the Age of 65 Comparison
Cambodians
Macedonians
10.4%
SENIORS POVERTY OVER THE AGE OF 65
89.1/ 100
METRIC RATING
127th/ 347
METRIC RANK
9.9%
SENIORS POVERTY OVER THE AGE OF 65
98.8/ 100
METRIC RATING
63rd/ 347
METRIC RANK
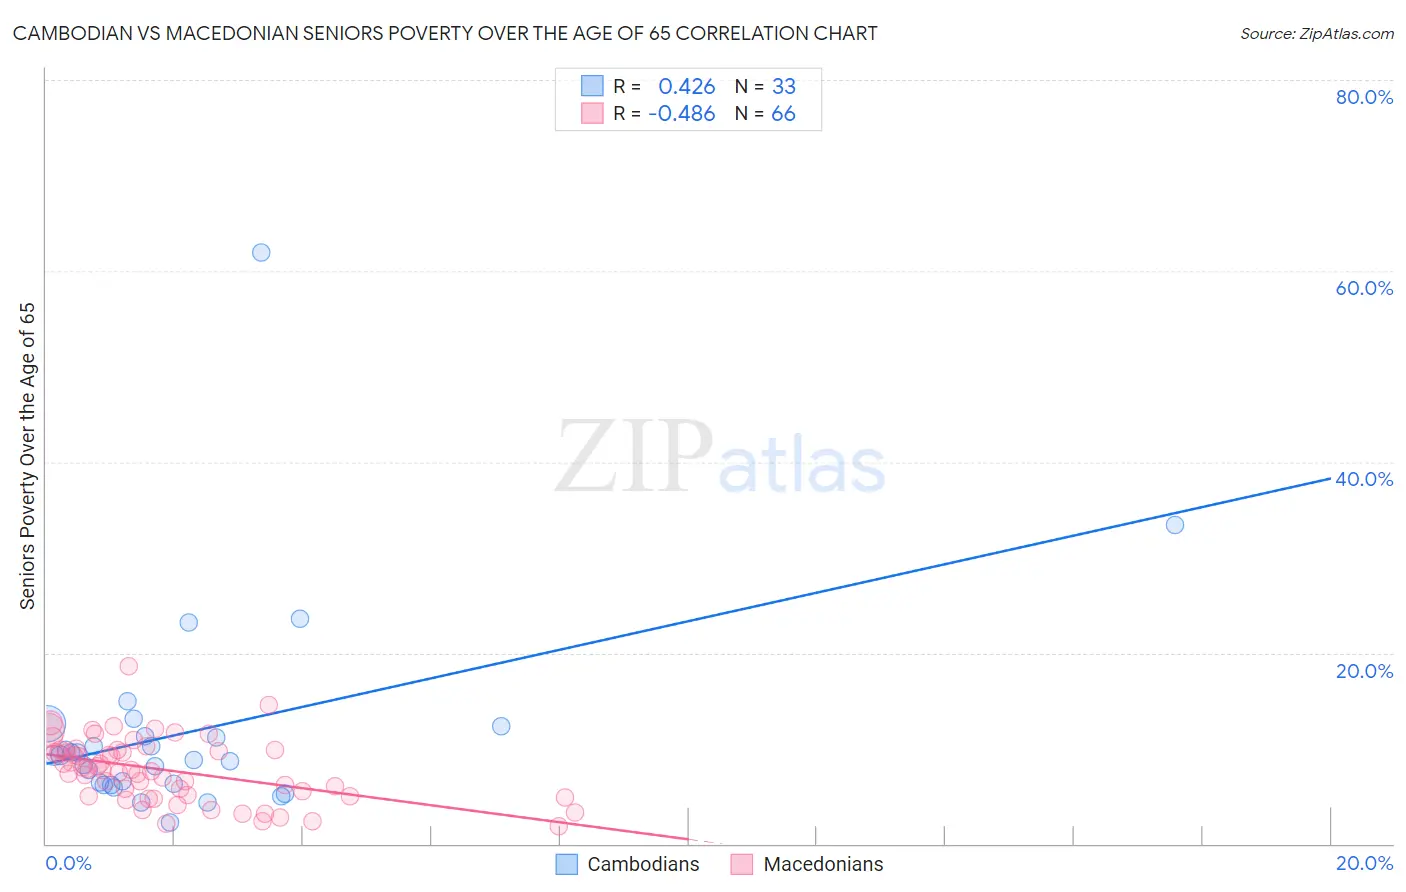
Cambodian vs Macedonian Seniors Poverty Over the Age of 65 Correlation Chart
The statistical analysis conducted on geographies consisting of 102,369,516 people shows a moderate positive correlation between the proportion of Cambodians and poverty level among seniors over the age of 65 in the United States with a correlation coefficient (R) of 0.426 and weighted average of 10.4%. Similarly, the statistical analysis conducted on geographies consisting of 132,515,092 people shows a moderate negative correlation between the proportion of Macedonians and poverty level among seniors over the age of 65 in the United States with a correlation coefficient (R) of -0.486 and weighted average of 9.9%, a difference of 5.8%.
Seniors Poverty Over the Age of 65 Correlation Summary
| Measurement | Cambodian | Macedonian |
| Minimum | 2.3% | 1.8% |
| Maximum | 61.9% | 18.6% |
| Range | 59.7% | 16.8% |
| Mean | 11.7% | 7.7% |
| Median | 9.3% | 7.7% |
| Interquartile 25% (IQ1) | 6.2% | 5.0% |
| Interquartile 75% (IQ3) | 11.8% | 9.8% |
| Interquartile Range (IQR) | 5.6% | 4.7% |
| Standard Deviation (Sample) | 10.9% | 3.3% |
| Standard Deviation (Population) | 10.8% | 3.3% |
Similar Demographics by Seniors Poverty Over the Age of 65
Demographics Similar to Cambodians by Seniors Poverty Over the Age of 65
In terms of seniors poverty over the age of 65, the demographic groups most similar to Cambodians are Immigrants from Hungary (10.4%, a difference of 0.0%), Immigrants from Philippines (10.4%, a difference of 0.070%), Ottawa (10.4%, a difference of 0.13%), Immigrants from Iran (10.4%, a difference of 0.15%), and Immigrants from Oceania (10.4%, a difference of 0.15%).
| Demographics | Rating | Rank | Seniors Poverty Over the Age of 65 |
| Immigrants | Bosnia and Herzegovina | 90.8 /100 | #120 | Exceptional 10.4% |
| Immigrants | Iraq | 90.7 /100 | #121 | Exceptional 10.4% |
| Immigrants | Moldova | 90.7 /100 | #122 | Exceptional 10.4% |
| Hmong | 90.0 /100 | #123 | Exceptional 10.4% |
| Asians | 89.9 /100 | #124 | Excellent 10.4% |
| Immigrants | Philippines | 89.4 /100 | #125 | Excellent 10.4% |
| Immigrants | Hungary | 89.1 /100 | #126 | Excellent 10.4% |
| Cambodians | 89.1 /100 | #127 | Excellent 10.4% |
| Ottawa | 88.5 /100 | #128 | Excellent 10.4% |
| Immigrants | Iran | 88.4 /100 | #129 | Excellent 10.4% |
| Immigrants | Oceania | 88.4 /100 | #130 | Excellent 10.4% |
| Egyptians | 87.8 /100 | #131 | Excellent 10.5% |
| Immigrants | Turkey | 87.7 /100 | #132 | Excellent 10.5% |
| Guamanians/Chamorros | 87.5 /100 | #133 | Excellent 10.5% |
| Sierra Leoneans | 86.8 /100 | #134 | Excellent 10.5% |
Demographics Similar to Macedonians by Seniors Poverty Over the Age of 65
In terms of seniors poverty over the age of 65, the demographic groups most similar to Macedonians are Immigrants from North America (9.9%, a difference of 0.050%), French Canadian (9.8%, a difference of 0.18%), Iranian (9.8%, a difference of 0.22%), Celtic (9.8%, a difference of 0.31%), and Pennsylvania German (9.9%, a difference of 0.33%).
| Demographics | Rating | Rank | Seniors Poverty Over the Age of 65 |
| Immigrants | England | 99.1 /100 | #56 | Exceptional 9.8% |
| Bolivians | 99.1 /100 | #57 | Exceptional 9.8% |
| Serbians | 99.1 /100 | #58 | Exceptional 9.8% |
| Immigrants | Canada | 99.0 /100 | #59 | Exceptional 9.8% |
| Celtics | 99.0 /100 | #60 | Exceptional 9.8% |
| Iranians | 98.9 /100 | #61 | Exceptional 9.8% |
| French Canadians | 98.9 /100 | #62 | Exceptional 9.8% |
| Macedonians | 98.8 /100 | #63 | Exceptional 9.9% |
| Immigrants | North America | 98.8 /100 | #64 | Exceptional 9.9% |
| Pennsylvania Germans | 98.7 /100 | #65 | Exceptional 9.9% |
| Immigrants | Netherlands | 98.7 /100 | #66 | Exceptional 9.9% |
| Immigrants | Austria | 98.6 /100 | #67 | Exceptional 9.9% |
| Canadians | 98.5 /100 | #68 | Exceptional 9.9% |
| Australians | 98.4 /100 | #69 | Exceptional 9.9% |
| Samoans | 98.0 /100 | #70 | Exceptional 10.0% |