Cambodian vs Immigrants from Cameroon Single Father Households
COMPARE
Cambodian
Immigrants from Cameroon
Single Father Households
Single Father Households Comparison
Cambodians
Immigrants from Cameroon
2.0%
SINGLE FATHER HOUSEHOLDS
100.0/ 100
METRIC RATING
30th/ 347
METRIC RANK
2.5%
SINGLE FATHER HOUSEHOLDS
2.3/ 100
METRIC RATING
249th/ 347
METRIC RANK
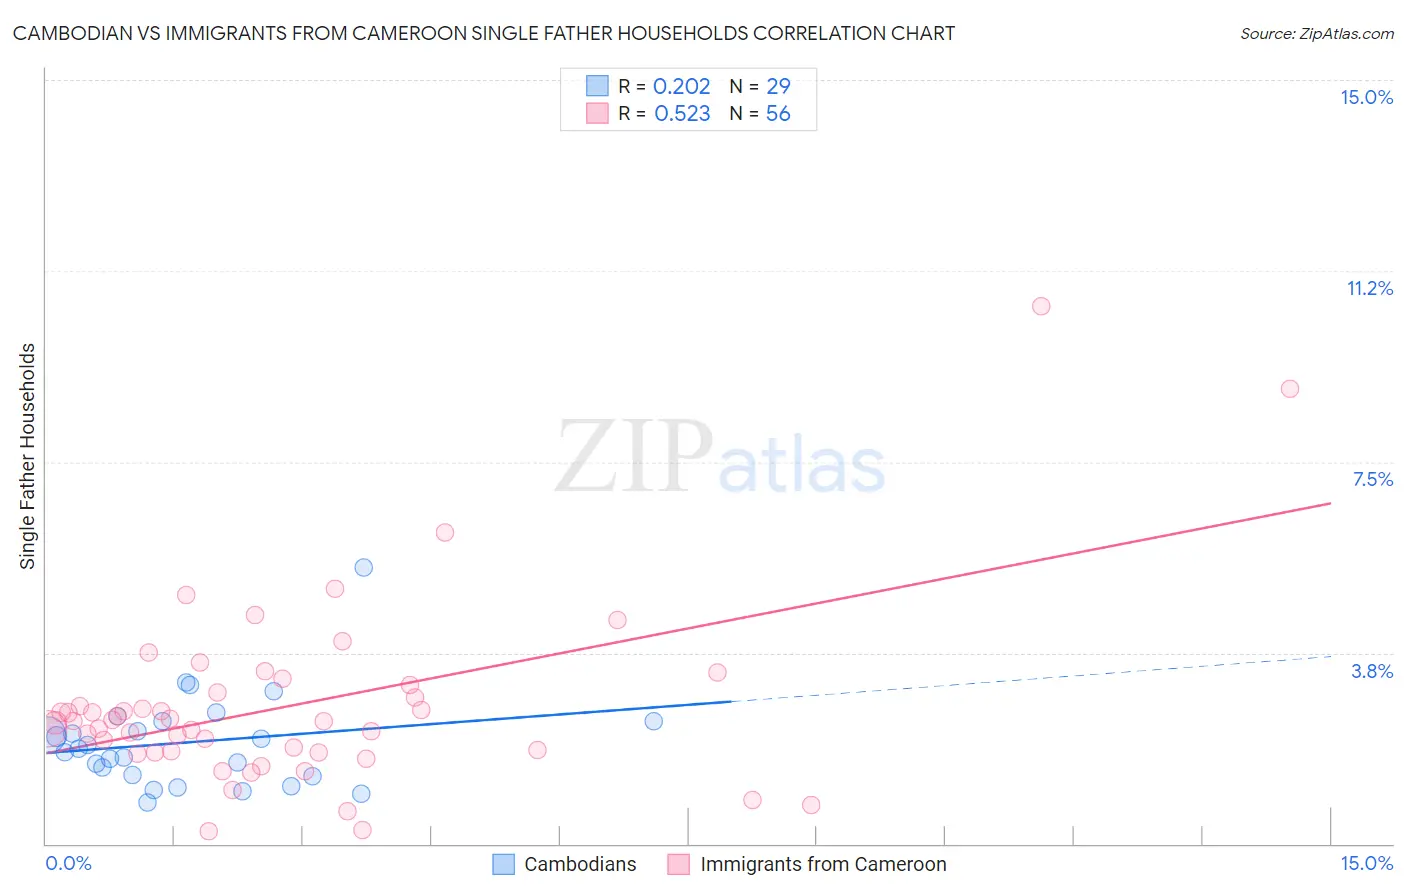
Cambodian vs Immigrants from Cameroon Single Father Households Correlation Chart
The statistical analysis conducted on geographies consisting of 102,339,342 people shows a weak positive correlation between the proportion of Cambodians and percentage of single father households in the United States with a correlation coefficient (R) of 0.202 and weighted average of 2.0%. Similarly, the statistical analysis conducted on geographies consisting of 130,430,432 people shows a substantial positive correlation between the proportion of Immigrants from Cameroon and percentage of single father households in the United States with a correlation coefficient (R) of 0.523 and weighted average of 2.5%, a difference of 26.8%.
Single Father Households Correlation Summary
| Measurement | Cambodian | Immigrants from Cameroon |
| Minimum | 0.80% | 0.24% |
| Maximum | 5.4% | 10.6% |
| Range | 4.6% | 10.3% |
| Mean | 2.0% | 2.7% |
| Median | 1.9% | 2.4% |
| Interquartile 25% (IQ1) | 1.3% | 1.8% |
| Interquartile 75% (IQ3) | 2.4% | 3.0% |
| Interquartile Range (IQR) | 1.1% | 1.2% |
| Standard Deviation (Sample) | 0.92% | 1.8% |
| Standard Deviation (Population) | 0.91% | 1.8% |
Similar Demographics by Single Father Households
Demographics Similar to Cambodians by Single Father Households
In terms of single father households, the demographic groups most similar to Cambodians are Bulgarian (2.0%, a difference of 0.020%), Israeli (2.0%, a difference of 0.030%), Chinese (2.0%, a difference of 0.070%), Immigrants from Japan (2.0%, a difference of 0.11%), and Turkish (2.0%, a difference of 0.28%).
| Demographics | Rating | Rank | Single Father Households |
| Immigrants | Croatia | 100.0 /100 | #23 | Exceptional 2.0% |
| Immigrants | Russia | 100.0 /100 | #24 | Exceptional 2.0% |
| Eastern Europeans | 100.0 /100 | #25 | Exceptional 2.0% |
| Assyrians/Chaldeans/Syriacs | 100.0 /100 | #26 | Exceptional 2.0% |
| Immigrants | South Central Asia | 100.0 /100 | #27 | Exceptional 2.0% |
| Immigrants | Japan | 100.0 /100 | #28 | Exceptional 2.0% |
| Bulgarians | 100.0 /100 | #29 | Exceptional 2.0% |
| Cambodians | 100.0 /100 | #30 | Exceptional 2.0% |
| Israelis | 100.0 /100 | #31 | Exceptional 2.0% |
| Chinese | 100.0 /100 | #32 | Exceptional 2.0% |
| Turks | 100.0 /100 | #33 | Exceptional 2.0% |
| Immigrants | Australia | 100.0 /100 | #34 | Exceptional 2.0% |
| Albanians | 100.0 /100 | #35 | Exceptional 2.0% |
| Immigrants | Belgium | 100.0 /100 | #36 | Exceptional 2.0% |
| Immigrants | St. Vincent and the Grenadines | 100.0 /100 | #37 | Exceptional 2.0% |
Demographics Similar to Immigrants from Cameroon by Single Father Households
In terms of single father households, the demographic groups most similar to Immigrants from Cameroon are Bahamian (2.5%, a difference of 0.090%), Delaware (2.5%, a difference of 0.13%), Native Hawaiian (2.5%, a difference of 0.14%), Basque (2.5%, a difference of 0.16%), and Somali (2.5%, a difference of 0.17%).
| Demographics | Rating | Rank | Single Father Households |
| Osage | 4.1 /100 | #242 | Tragic 2.5% |
| Spaniards | 3.1 /100 | #243 | Tragic 2.5% |
| Immigrants | Middle Africa | 2.8 /100 | #244 | Tragic 2.5% |
| Basques | 2.5 /100 | #245 | Tragic 2.5% |
| Native Hawaiians | 2.5 /100 | #246 | Tragic 2.5% |
| Delaware | 2.5 /100 | #247 | Tragic 2.5% |
| Bahamians | 2.4 /100 | #248 | Tragic 2.5% |
| Immigrants | Cameroon | 2.3 /100 | #249 | Tragic 2.5% |
| Somalis | 2.1 /100 | #250 | Tragic 2.5% |
| Liberians | 2.0 /100 | #251 | Tragic 2.5% |
| Immigrants | Eritrea | 2.0 /100 | #252 | Tragic 2.5% |
| Immigrants | Somalia | 1.9 /100 | #253 | Tragic 2.5% |
| Immigrants | Thailand | 1.8 /100 | #254 | Tragic 2.5% |
| Tongans | 1.5 /100 | #255 | Tragic 2.5% |
| Potawatomi | 1.4 /100 | #256 | Tragic 2.5% |