Guatemalan vs Macedonian Single Father Households
COMPARE
Guatemalan
Macedonian
Single Father Households
Single Father Households Comparison
Guatemalans
Macedonians
3.0%
SINGLE FATHER HOUSEHOLDS
0.0/ 100
METRIC RATING
320th/ 347
METRIC RANK
2.0%
SINGLE FATHER HOUSEHOLDS
100.0/ 100
METRIC RATING
42nd/ 347
METRIC RANK
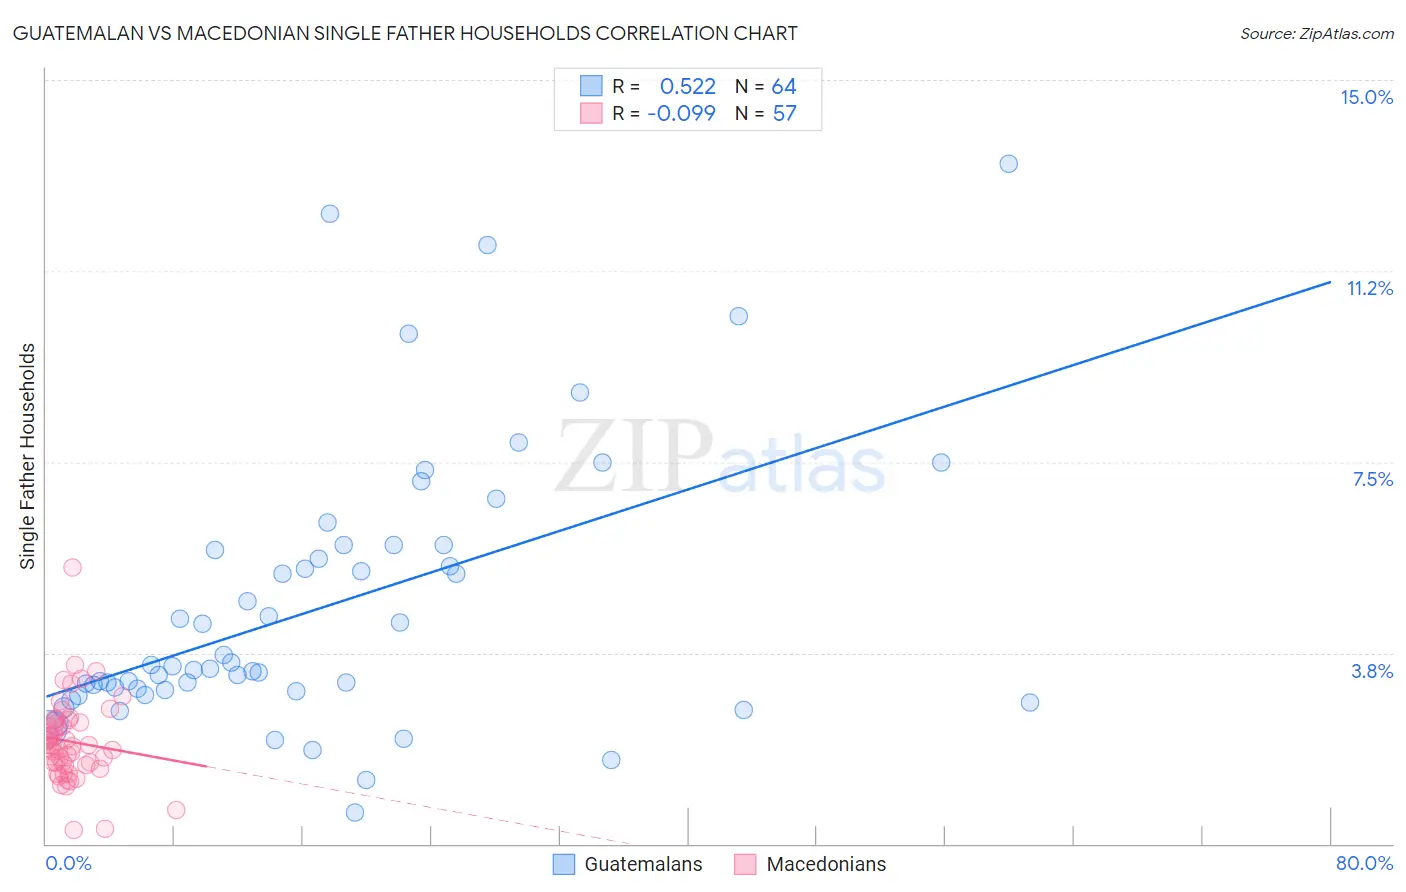
Guatemalan vs Macedonian Single Father Households Correlation Chart
The statistical analysis conducted on geographies consisting of 406,583,084 people shows a substantial positive correlation between the proportion of Guatemalans and percentage of single father households in the United States with a correlation coefficient (R) of 0.522 and weighted average of 3.0%. Similarly, the statistical analysis conducted on geographies consisting of 132,178,370 people shows a slight negative correlation between the proportion of Macedonians and percentage of single father households in the United States with a correlation coefficient (R) of -0.099 and weighted average of 2.0%, a difference of 48.3%.
Single Father Households Correlation Summary
| Measurement | Guatemalan | Macedonian |
| Minimum | 0.62% | 0.27% |
| Maximum | 13.4% | 5.4% |
| Range | 12.7% | 5.1% |
| Mean | 4.6% | 2.0% |
| Median | 3.5% | 1.9% |
| Interquartile 25% (IQ1) | 3.0% | 1.6% |
| Interquartile 75% (IQ3) | 5.8% | 2.4% |
| Interquartile Range (IQR) | 2.8% | 0.86% |
| Standard Deviation (Sample) | 2.7% | 0.83% |
| Standard Deviation (Population) | 2.7% | 0.82% |
Similar Demographics by Single Father Households
Demographics Similar to Guatemalans by Single Father Households
In terms of single father households, the demographic groups most similar to Guatemalans are Ute (3.0%, a difference of 0.080%), Mexican (3.0%, a difference of 0.39%), Cape Verdean (2.9%, a difference of 0.61%), Immigrants from El Salvador (2.9%, a difference of 0.62%), and Immigrants from Guatemala (3.0%, a difference of 0.92%).
| Demographics | Rating | Rank | Single Father Households |
| Arapaho | 0.0 /100 | #313 | Tragic 2.9% |
| Salvadorans | 0.0 /100 | #314 | Tragic 2.9% |
| Cheyenne | 0.0 /100 | #315 | Tragic 2.9% |
| Houma | 0.0 /100 | #316 | Tragic 2.9% |
| Immigrants | El Salvador | 0.0 /100 | #317 | Tragic 2.9% |
| Cape Verdeans | 0.0 /100 | #318 | Tragic 2.9% |
| Ute | 0.0 /100 | #319 | Tragic 3.0% |
| Guatemalans | 0.0 /100 | #320 | Tragic 3.0% |
| Mexicans | 0.0 /100 | #321 | Tragic 3.0% |
| Immigrants | Guatemala | 0.0 /100 | #322 | Tragic 3.0% |
| Immigrants | Central America | 0.0 /100 | #323 | Tragic 3.0% |
| Fijians | 0.0 /100 | #324 | Tragic 3.0% |
| Immigrants | Mexico | 0.0 /100 | #325 | Tragic 3.0% |
| Aleuts | 0.0 /100 | #326 | Tragic 3.0% |
| Bangladeshis | 0.0 /100 | #327 | Tragic 3.1% |
Demographics Similar to Macedonians by Single Father Households
In terms of single father households, the demographic groups most similar to Macedonians are Immigrants from Turkey (2.0%, a difference of 0.15%), Immigrants from Grenada (2.0%, a difference of 0.23%), Latvian (2.0%, a difference of 0.31%), Immigrants from Bulgaria (2.0%, a difference of 0.33%), and Russian (2.0%, a difference of 0.33%).
| Demographics | Rating | Rank | Single Father Households |
| Albanians | 100.0 /100 | #35 | Exceptional 2.0% |
| Immigrants | Belgium | 100.0 /100 | #36 | Exceptional 2.0% |
| Immigrants | St. Vincent and the Grenadines | 100.0 /100 | #37 | Exceptional 2.0% |
| Immigrants | Eastern Europe | 100.0 /100 | #38 | Exceptional 2.0% |
| Immigrants | Sri Lanka | 100.0 /100 | #39 | Exceptional 2.0% |
| Immigrants | Bulgaria | 100.0 /100 | #40 | Exceptional 2.0% |
| Immigrants | Turkey | 100.0 /100 | #41 | Exceptional 2.0% |
| Macedonians | 100.0 /100 | #42 | Exceptional 2.0% |
| Immigrants | Grenada | 100.0 /100 | #43 | Exceptional 2.0% |
| Latvians | 100.0 /100 | #44 | Exceptional 2.0% |
| Russians | 100.0 /100 | #45 | Exceptional 2.0% |
| Immigrants | Lebanon | 100.0 /100 | #46 | Exceptional 2.0% |
| Immigrants | Ukraine | 99.9 /100 | #47 | Exceptional 2.0% |
| Immigrants | Kazakhstan | 99.9 /100 | #48 | Exceptional 2.0% |
| Immigrants | Serbia | 99.9 /100 | #49 | Exceptional 2.0% |