Cambodian vs Laotian Average Family Size
COMPARE
Cambodian
Laotian
Average Family Size
Average Family Size Comparison
Cambodians
Laotians
3.15
AVERAGE FAMILY SIZE
0.6/ 100
METRIC RATING
275th/ 347
METRIC RANK
3.26
AVERAGE FAMILY SIZE
88.5/ 100
METRIC RATING
130th/ 347
METRIC RANK
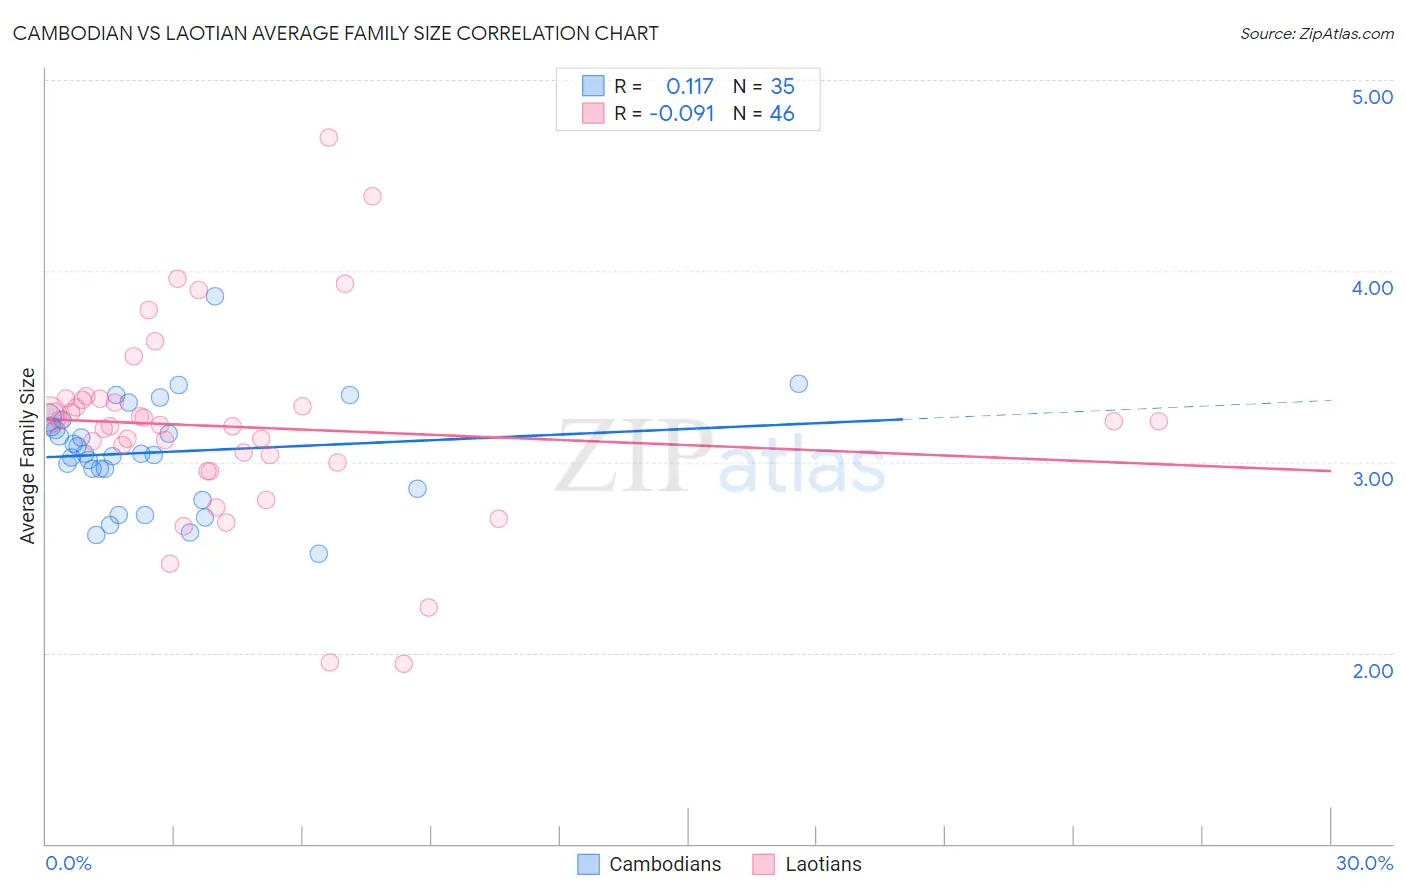
Cambodian vs Laotian Average Family Size Correlation Chart
The statistical analysis conducted on geographies consisting of 102,468,433 people shows a poor positive correlation between the proportion of Cambodians and average family size in the United States with a correlation coefficient (R) of 0.117 and weighted average of 3.15. Similarly, the statistical analysis conducted on geographies consisting of 224,743,344 people shows a slight negative correlation between the proportion of Laotians and average family size in the United States with a correlation coefficient (R) of -0.091 and weighted average of 3.26, a difference of 3.3%.
Average Family Size Correlation Summary
| Measurement | Cambodian | Laotian |
| Minimum | 2.52 | 1.94 |
| Maximum | 3.87 | 4.70 |
| Range | 1.35 | 2.76 |
| Mean | 3.05 | 3.18 |
| Median | 3.04 | 3.20 |
| Interquartile 25% (IQ1) | 2.86 | 3.00 |
| Interquartile 75% (IQ3) | 3.22 | 3.32 |
| Interquartile Range (IQR) | 0.36 | 0.32 |
| Standard Deviation (Sample) | 0.28 | 0.52 |
| Standard Deviation (Population) | 0.27 | 0.51 |
Similar Demographics by Average Family Size
Demographics Similar to Cambodians by Average Family Size
In terms of average family size, the demographic groups most similar to Cambodians are Immigrants from Belgium (3.15, a difference of 0.0%), New Zealander (3.15, a difference of 0.010%), Immigrants from Lithuania (3.15, a difference of 0.020%), Immigrants from Germany (3.15, a difference of 0.040%), and Tlingit-Haida (3.16, a difference of 0.060%).
| Demographics | Rating | Rank | Average Family Size |
| Maltese | 0.8 /100 | #268 | Tragic 3.16 |
| Immigrants | Singapore | 0.7 /100 | #269 | Tragic 3.16 |
| Tlingit-Haida | 0.7 /100 | #270 | Tragic 3.16 |
| Immigrants | Germany | 0.7 /100 | #271 | Tragic 3.15 |
| Immigrants | Lithuania | 0.6 /100 | #272 | Tragic 3.15 |
| New Zealanders | 0.6 /100 | #273 | Tragic 3.15 |
| Immigrants | Belgium | 0.6 /100 | #274 | Tragic 3.15 |
| Cambodians | 0.6 /100 | #275 | Tragic 3.15 |
| Immigrants | Bosnia and Herzegovina | 0.5 /100 | #276 | Tragic 3.15 |
| Swiss | 0.5 /100 | #277 | Tragic 3.15 |
| Okinawans | 0.5 /100 | #278 | Tragic 3.15 |
| Immigrants | Europe | 0.5 /100 | #279 | Tragic 3.15 |
| Immigrants | England | 0.4 /100 | #280 | Tragic 3.15 |
| Immigrants | Denmark | 0.4 /100 | #281 | Tragic 3.15 |
| Yugoslavians | 0.4 /100 | #282 | Tragic 3.15 |
Demographics Similar to Laotians by Average Family Size
In terms of average family size, the demographic groups most similar to Laotians are Immigrants from Hong Kong (3.26, a difference of 0.010%), Immigrants from Western Asia (3.26, a difference of 0.030%), Colombian (3.26, a difference of 0.060%), Costa Rican (3.26, a difference of 0.070%), and Immigrants from Venezuela (3.26, a difference of 0.090%).
| Demographics | Rating | Rank | Average Family Size |
| Alaskan Athabascans | 92.4 /100 | #123 | Exceptional 3.27 |
| South American Indians | 91.6 /100 | #124 | Exceptional 3.26 |
| Immigrants | Cuba | 91.3 /100 | #125 | Exceptional 3.26 |
| Immigrants | Costa Rica | 90.7 /100 | #126 | Exceptional 3.26 |
| Immigrants | Syria | 90.6 /100 | #127 | Exceptional 3.26 |
| Colombians | 89.9 /100 | #128 | Excellent 3.26 |
| Immigrants | Hong Kong | 88.6 /100 | #129 | Excellent 3.26 |
| Laotians | 88.5 /100 | #130 | Excellent 3.26 |
| Immigrants | Western Asia | 87.7 /100 | #131 | Excellent 3.26 |
| Costa Ricans | 86.8 /100 | #132 | Excellent 3.26 |
| Immigrants | Venezuela | 86.3 /100 | #133 | Excellent 3.26 |
| Africans | 84.9 /100 | #134 | Excellent 3.25 |
| Panamanians | 84.2 /100 | #135 | Excellent 3.25 |
| Comanche | 82.8 /100 | #136 | Excellent 3.25 |
| Immigrants | Middle Africa | 82.4 /100 | #137 | Excellent 3.25 |