Cambodian vs Arab Average Family Size
COMPARE
Cambodian
Arab
Average Family Size
Average Family Size Comparison
Cambodians
Arabs
3.15
AVERAGE FAMILY SIZE
0.6/ 100
METRIC RATING
275th/ 347
METRIC RANK
3.23
AVERAGE FAMILY SIZE
53.8/ 100
METRIC RATING
170th/ 347
METRIC RANK
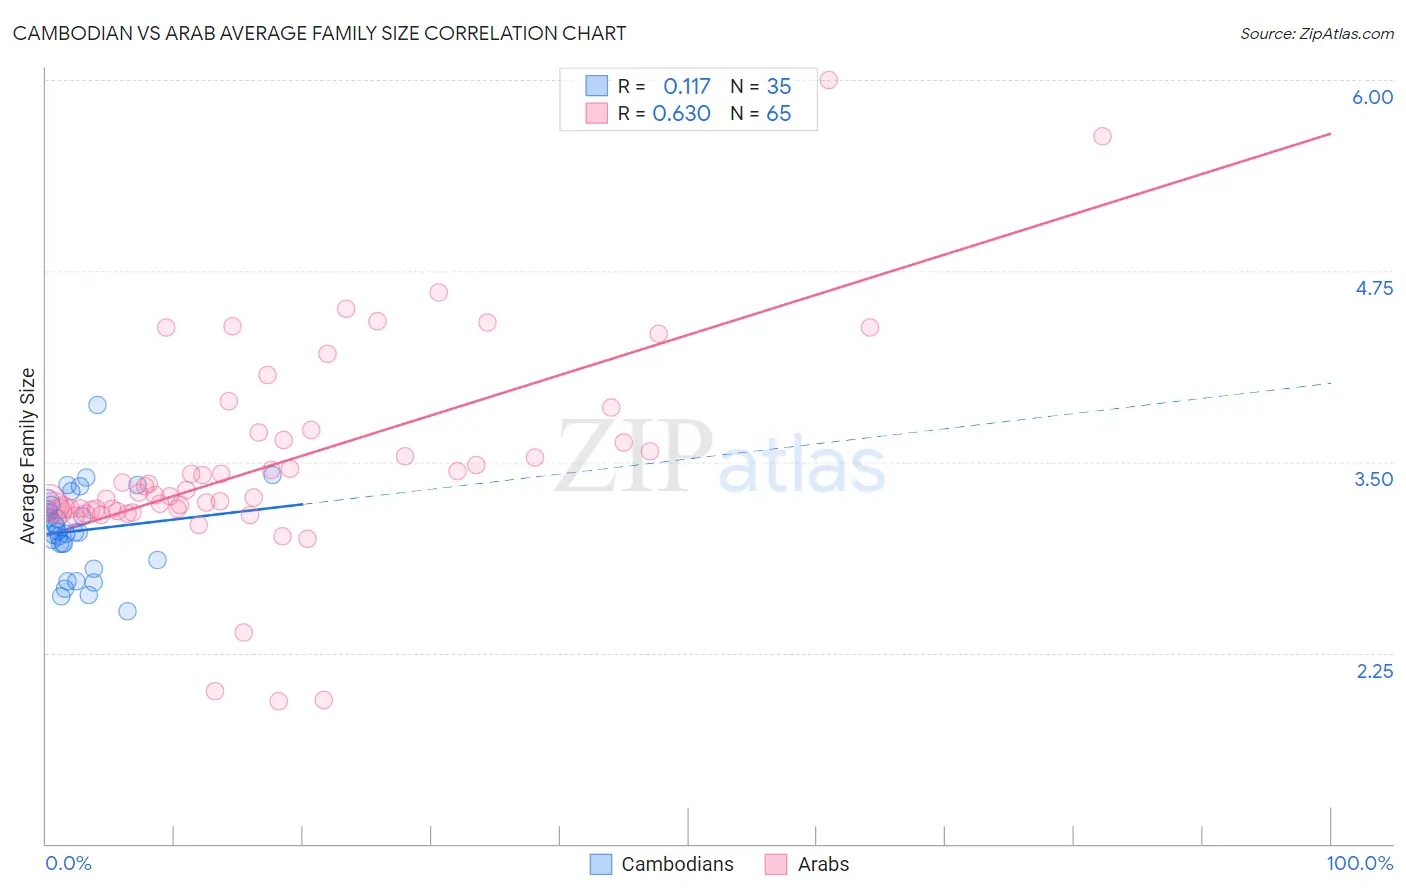
Cambodian vs Arab Average Family Size Correlation Chart
The statistical analysis conducted on geographies consisting of 102,468,433 people shows a poor positive correlation between the proportion of Cambodians and average family size in the United States with a correlation coefficient (R) of 0.117 and weighted average of 3.15. Similarly, the statistical analysis conducted on geographies consisting of 486,389,490 people shows a significant positive correlation between the proportion of Arabs and average family size in the United States with a correlation coefficient (R) of 0.630 and weighted average of 3.23, a difference of 2.4%.
Average Family Size Correlation Summary
| Measurement | Cambodian | Arab |
| Minimum | 2.52 | 1.93 |
| Maximum | 3.87 | 6.00 |
| Range | 1.35 | 4.07 |
| Mean | 3.05 | 3.49 |
| Median | 3.04 | 3.30 |
| Interquartile 25% (IQ1) | 2.86 | 3.19 |
| Interquartile 75% (IQ3) | 3.22 | 3.67 |
| Interquartile Range (IQR) | 0.36 | 0.48 |
| Standard Deviation (Sample) | 0.28 | 0.69 |
| Standard Deviation (Population) | 0.27 | 0.68 |
Similar Demographics by Average Family Size
Demographics Similar to Cambodians by Average Family Size
In terms of average family size, the demographic groups most similar to Cambodians are Immigrants from Belgium (3.15, a difference of 0.0%), New Zealander (3.15, a difference of 0.010%), Immigrants from Lithuania (3.15, a difference of 0.020%), Immigrants from Germany (3.15, a difference of 0.040%), and Tlingit-Haida (3.16, a difference of 0.060%).
| Demographics | Rating | Rank | Average Family Size |
| Maltese | 0.8 /100 | #268 | Tragic 3.16 |
| Immigrants | Singapore | 0.7 /100 | #269 | Tragic 3.16 |
| Tlingit-Haida | 0.7 /100 | #270 | Tragic 3.16 |
| Immigrants | Germany | 0.7 /100 | #271 | Tragic 3.15 |
| Immigrants | Lithuania | 0.6 /100 | #272 | Tragic 3.15 |
| New Zealanders | 0.6 /100 | #273 | Tragic 3.15 |
| Immigrants | Belgium | 0.6 /100 | #274 | Tragic 3.15 |
| Cambodians | 0.6 /100 | #275 | Tragic 3.15 |
| Immigrants | Bosnia and Herzegovina | 0.5 /100 | #276 | Tragic 3.15 |
| Swiss | 0.5 /100 | #277 | Tragic 3.15 |
| Okinawans | 0.5 /100 | #278 | Tragic 3.15 |
| Immigrants | Europe | 0.5 /100 | #279 | Tragic 3.15 |
| Immigrants | England | 0.4 /100 | #280 | Tragic 3.15 |
| Immigrants | Denmark | 0.4 /100 | #281 | Tragic 3.15 |
| Yugoslavians | 0.4 /100 | #282 | Tragic 3.15 |
Demographics Similar to Arabs by Average Family Size
In terms of average family size, the demographic groups most similar to Arabs are Taiwanese (3.23, a difference of 0.010%), Aleut (3.23, a difference of 0.010%), Chilean (3.23, a difference of 0.010%), Immigrants from Congo (3.23, a difference of 0.020%), and Immigrants from Uruguay (3.23, a difference of 0.030%).
| Demographics | Rating | Rank | Average Family Size |
| Uruguayans | 58.8 /100 | #163 | Average 3.23 |
| Egyptians | 58.6 /100 | #164 | Average 3.23 |
| Ugandans | 58.4 /100 | #165 | Average 3.23 |
| Immigrants | Senegal | 57.5 /100 | #166 | Average 3.23 |
| Dutch West Indians | 56.9 /100 | #167 | Average 3.23 |
| Taiwanese | 54.2 /100 | #168 | Average 3.23 |
| Aleuts | 54.1 /100 | #169 | Average 3.23 |
| Arabs | 53.8 /100 | #170 | Average 3.23 |
| Chileans | 53.2 /100 | #171 | Average 3.23 |
| Immigrants | Congo | 52.7 /100 | #172 | Average 3.23 |
| Immigrants | Uruguay | 52.0 /100 | #173 | Average 3.23 |
| Immigrants | South Central Asia | 50.0 /100 | #174 | Average 3.23 |
| Immigrants | China | 49.9 /100 | #175 | Average 3.23 |
| Israelis | 48.7 /100 | #176 | Average 3.23 |
| Argentineans | 47.4 /100 | #177 | Average 3.23 |