Cambodian vs Immigrants from Western Europe Average Family Size
COMPARE
Cambodian
Immigrants from Western Europe
Average Family Size
Average Family Size Comparison
Cambodians
Immigrants from Western Europe
3.15
AVERAGE FAMILY SIZE
0.6/ 100
METRIC RATING
275th/ 347
METRIC RANK
3.14
AVERAGE FAMILY SIZE
0.2/ 100
METRIC RATING
297th/ 347
METRIC RANK
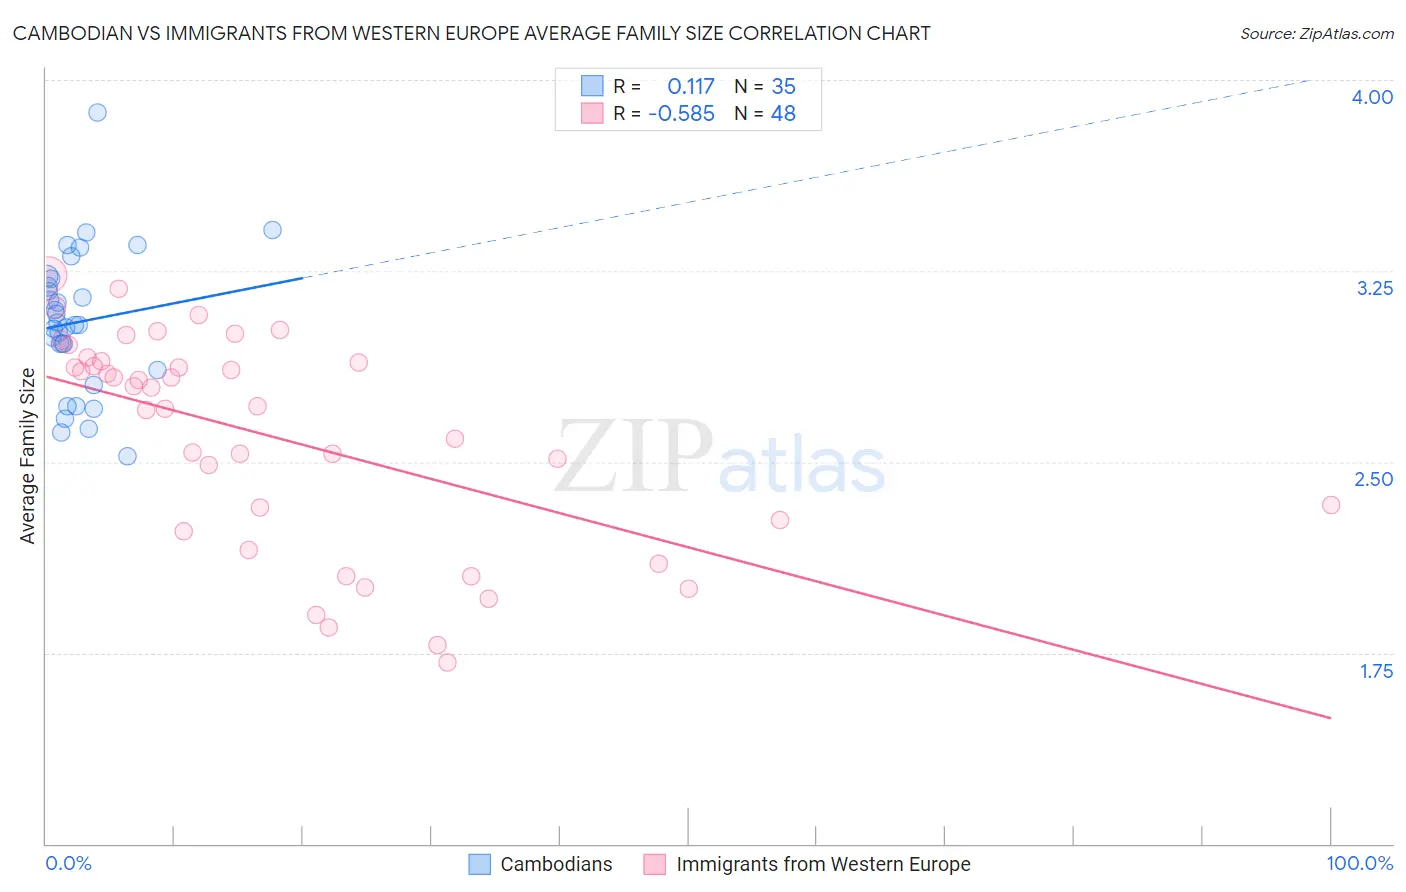
Cambodian vs Immigrants from Western Europe Average Family Size Correlation Chart
The statistical analysis conducted on geographies consisting of 102,468,433 people shows a poor positive correlation between the proportion of Cambodians and average family size in the United States with a correlation coefficient (R) of 0.117 and weighted average of 3.15. Similarly, the statistical analysis conducted on geographies consisting of 493,828,171 people shows a substantial negative correlation between the proportion of Immigrants from Western Europe and average family size in the United States with a correlation coefficient (R) of -0.585 and weighted average of 3.14, a difference of 0.48%.
Average Family Size Correlation Summary
| Measurement | Cambodian | Immigrants from Western Europe |
| Minimum | 2.52 | 1.71 |
| Maximum | 3.87 | 3.23 |
| Range | 1.35 | 1.52 |
| Mean | 3.05 | 2.59 |
| Median | 3.04 | 2.76 |
| Interquartile 25% (IQ1) | 2.86 | 2.25 |
| Interquartile 75% (IQ3) | 3.22 | 2.89 |
| Interquartile Range (IQR) | 0.36 | 0.65 |
| Standard Deviation (Sample) | 0.28 | 0.42 |
| Standard Deviation (Population) | 0.27 | 0.41 |
Similar Demographics by Average Family Size
Demographics Similar to Cambodians by Average Family Size
In terms of average family size, the demographic groups most similar to Cambodians are Immigrants from Belgium (3.15, a difference of 0.0%), New Zealander (3.15, a difference of 0.010%), Immigrants from Lithuania (3.15, a difference of 0.020%), Immigrants from Germany (3.15, a difference of 0.040%), and Tlingit-Haida (3.16, a difference of 0.060%).
| Demographics | Rating | Rank | Average Family Size |
| Maltese | 0.8 /100 | #268 | Tragic 3.16 |
| Immigrants | Singapore | 0.7 /100 | #269 | Tragic 3.16 |
| Tlingit-Haida | 0.7 /100 | #270 | Tragic 3.16 |
| Immigrants | Germany | 0.7 /100 | #271 | Tragic 3.15 |
| Immigrants | Lithuania | 0.6 /100 | #272 | Tragic 3.15 |
| New Zealanders | 0.6 /100 | #273 | Tragic 3.15 |
| Immigrants | Belgium | 0.6 /100 | #274 | Tragic 3.15 |
| Cambodians | 0.6 /100 | #275 | Tragic 3.15 |
| Immigrants | Bosnia and Herzegovina | 0.5 /100 | #276 | Tragic 3.15 |
| Swiss | 0.5 /100 | #277 | Tragic 3.15 |
| Okinawans | 0.5 /100 | #278 | Tragic 3.15 |
| Immigrants | Europe | 0.5 /100 | #279 | Tragic 3.15 |
| Immigrants | England | 0.4 /100 | #280 | Tragic 3.15 |
| Immigrants | Denmark | 0.4 /100 | #281 | Tragic 3.15 |
| Yugoslavians | 0.4 /100 | #282 | Tragic 3.15 |
Demographics Similar to Immigrants from Western Europe by Average Family Size
In terms of average family size, the demographic groups most similar to Immigrants from Western Europe are Austrian (3.14, a difference of 0.0%), Ukrainian (3.14, a difference of 0.0%), Colville (3.14, a difference of 0.0%), Immigrants from Croatia (3.14, a difference of 0.010%), and Scandinavian (3.14, a difference of 0.030%).
| Demographics | Rating | Rank | Average Family Size |
| Cypriots | 0.3 /100 | #290 | Tragic 3.14 |
| Alsatians | 0.2 /100 | #291 | Tragic 3.14 |
| Europeans | 0.2 /100 | #292 | Tragic 3.14 |
| Scandinavians | 0.2 /100 | #293 | Tragic 3.14 |
| Immigrants | Croatia | 0.2 /100 | #294 | Tragic 3.14 |
| Austrians | 0.2 /100 | #295 | Tragic 3.14 |
| Ukrainians | 0.2 /100 | #296 | Tragic 3.14 |
| Immigrants | Western Europe | 0.2 /100 | #297 | Tragic 3.14 |
| Colville | 0.2 /100 | #298 | Tragic 3.14 |
| Canadians | 0.2 /100 | #299 | Tragic 3.14 |
| Immigrants | Sweden | 0.2 /100 | #300 | Tragic 3.14 |
| Macedonians | 0.2 /100 | #301 | Tragic 3.13 |
| Immigrants | Latvia | 0.2 /100 | #302 | Tragic 3.13 |
| British | 0.2 /100 | #303 | Tragic 3.13 |
| Immigrants | Switzerland | 0.2 /100 | #304 | Tragic 3.13 |