Nonimmigrants vs Laotian Average Family Size
COMPARE
Nonimmigrants
Laotian
Average Family Size
Average Family Size Comparison
Nonimmigrants
Laotians
3.19
AVERAGE FAMILY SIZE
5.7/ 100
METRIC RATING
228th/ 347
METRIC RANK
3.26
AVERAGE FAMILY SIZE
88.5/ 100
METRIC RATING
130th/ 347
METRIC RANK
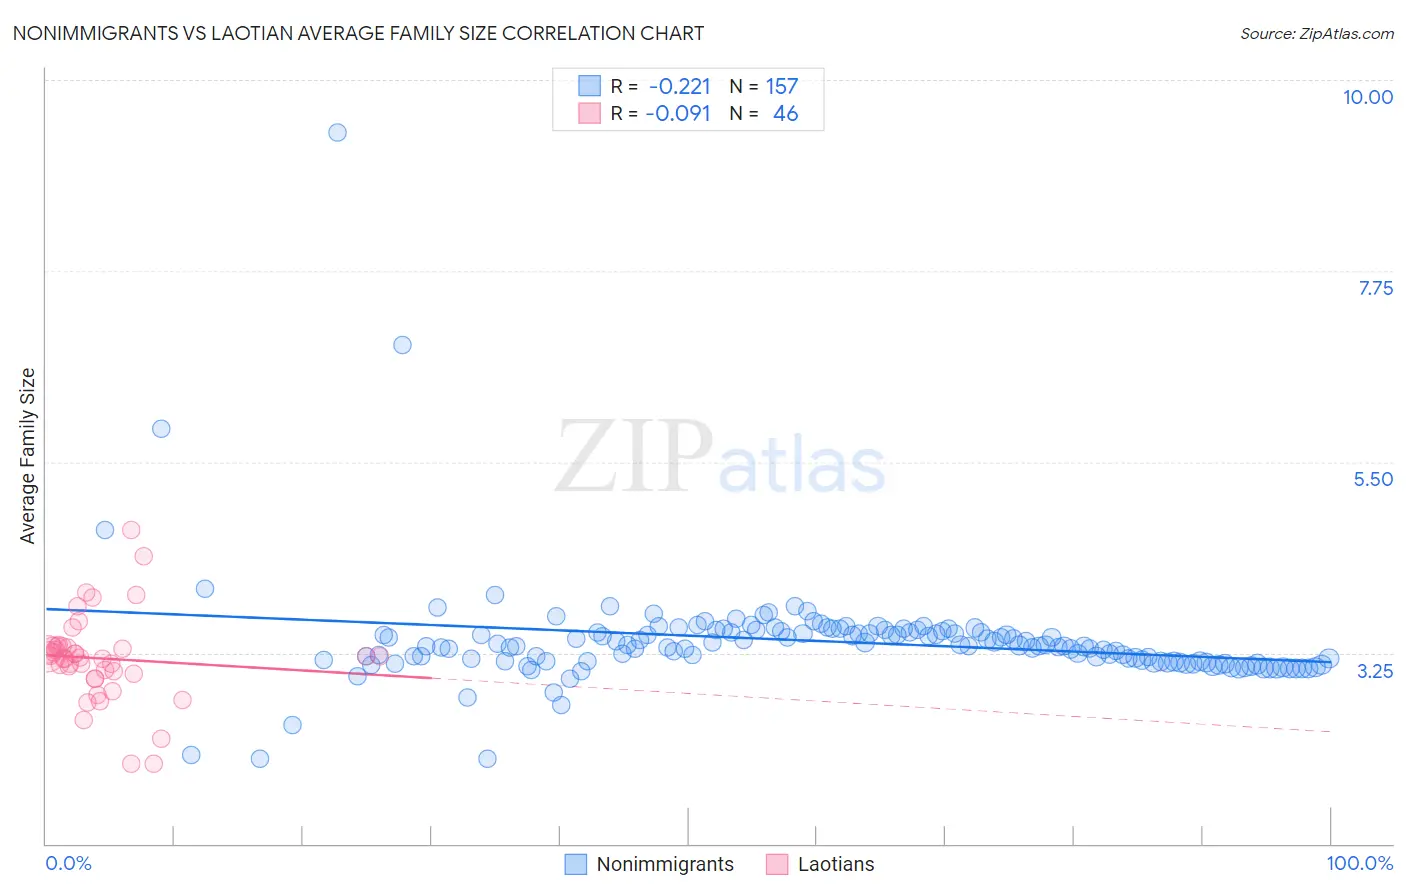
Nonimmigrants vs Laotian Average Family Size Correlation Chart
The statistical analysis conducted on geographies consisting of 584,651,869 people shows a weak negative correlation between the proportion of Nonimmigrants and average family size in the United States with a correlation coefficient (R) of -0.221 and weighted average of 3.19. Similarly, the statistical analysis conducted on geographies consisting of 224,743,344 people shows a slight negative correlation between the proportion of Laotians and average family size in the United States with a correlation coefficient (R) of -0.091 and weighted average of 3.26, a difference of 2.2%.
Average Family Size Correlation Summary
| Measurement | Nonimmigrants | Laotian |
| Minimum | 2.00 | 1.94 |
| Maximum | 9.38 | 4.70 |
| Range | 7.38 | 2.76 |
| Mean | 3.39 | 3.18 |
| Median | 3.33 | 3.20 |
| Interquartile 25% (IQ1) | 3.14 | 3.00 |
| Interquartile 75% (IQ3) | 3.50 | 3.32 |
| Interquartile Range (IQR) | 0.36 | 0.32 |
| Standard Deviation (Sample) | 0.67 | 0.52 |
| Standard Deviation (Population) | 0.67 | 0.51 |
Similar Demographics by Average Family Size
Demographics Similar to Nonimmigrants by Average Family Size
In terms of average family size, the demographic groups most similar to Nonimmigrants are Portuguese (3.19, a difference of 0.020%), Chickasaw (3.19, a difference of 0.030%), Cree (3.19, a difference of 0.040%), Immigrants from Italy (3.19, a difference of 0.040%), and Icelander (3.19, a difference of 0.050%).
| Demographics | Rating | Rank | Average Family Size |
| Immigrants | Ukraine | 7.2 /100 | #221 | Tragic 3.19 |
| Immigrants | Kuwait | 7.2 /100 | #222 | Tragic 3.19 |
| Immigrants | Zimbabwe | 7.1 /100 | #223 | Tragic 3.19 |
| Syrians | 6.5 /100 | #224 | Tragic 3.19 |
| Cree | 6.2 /100 | #225 | Tragic 3.19 |
| Chickasaw | 6.0 /100 | #226 | Tragic 3.19 |
| Portuguese | 6.0 /100 | #227 | Tragic 3.19 |
| Immigrants | Nonimmigrants | 5.7 /100 | #228 | Tragic 3.19 |
| Immigrants | Italy | 5.3 /100 | #229 | Tragic 3.19 |
| Icelanders | 5.2 /100 | #230 | Tragic 3.19 |
| Basques | 5.2 /100 | #231 | Tragic 3.19 |
| Cherokee | 4.7 /100 | #232 | Tragic 3.18 |
| Brazilians | 4.5 /100 | #233 | Tragic 3.18 |
| Iranians | 4.5 /100 | #234 | Tragic 3.18 |
| Immigrants | Turkey | 4.2 /100 | #235 | Tragic 3.18 |
Demographics Similar to Laotians by Average Family Size
In terms of average family size, the demographic groups most similar to Laotians are Immigrants from Hong Kong (3.26, a difference of 0.010%), Immigrants from Western Asia (3.26, a difference of 0.030%), Colombian (3.26, a difference of 0.060%), Costa Rican (3.26, a difference of 0.070%), and Immigrants from Venezuela (3.26, a difference of 0.090%).
| Demographics | Rating | Rank | Average Family Size |
| Alaskan Athabascans | 92.4 /100 | #123 | Exceptional 3.27 |
| South American Indians | 91.6 /100 | #124 | Exceptional 3.26 |
| Immigrants | Cuba | 91.3 /100 | #125 | Exceptional 3.26 |
| Immigrants | Costa Rica | 90.7 /100 | #126 | Exceptional 3.26 |
| Immigrants | Syria | 90.6 /100 | #127 | Exceptional 3.26 |
| Colombians | 89.9 /100 | #128 | Excellent 3.26 |
| Immigrants | Hong Kong | 88.6 /100 | #129 | Excellent 3.26 |
| Laotians | 88.5 /100 | #130 | Excellent 3.26 |
| Immigrants | Western Asia | 87.7 /100 | #131 | Excellent 3.26 |
| Costa Ricans | 86.8 /100 | #132 | Excellent 3.26 |
| Immigrants | Venezuela | 86.3 /100 | #133 | Excellent 3.26 |
| Africans | 84.9 /100 | #134 | Excellent 3.25 |
| Panamanians | 84.2 /100 | #135 | Excellent 3.25 |
| Comanche | 82.8 /100 | #136 | Excellent 3.25 |
| Immigrants | Middle Africa | 82.4 /100 | #137 | Excellent 3.25 |