Cambodian vs Laotian Householder Income Over 65 years
COMPARE
Cambodian
Laotian
Householder Income Over 65 years
Householder Income Over 65 years Comparison
Cambodians
Laotians
$66,892
HOUSEHOLDER INCOME OVER 65 YEARS
99.8/ 100
METRIC RATING
46th/ 347
METRIC RANK
$66,306
HOUSEHOLDER INCOME OVER 65 YEARS
99.6/ 100
METRIC RATING
56th/ 347
METRIC RANK
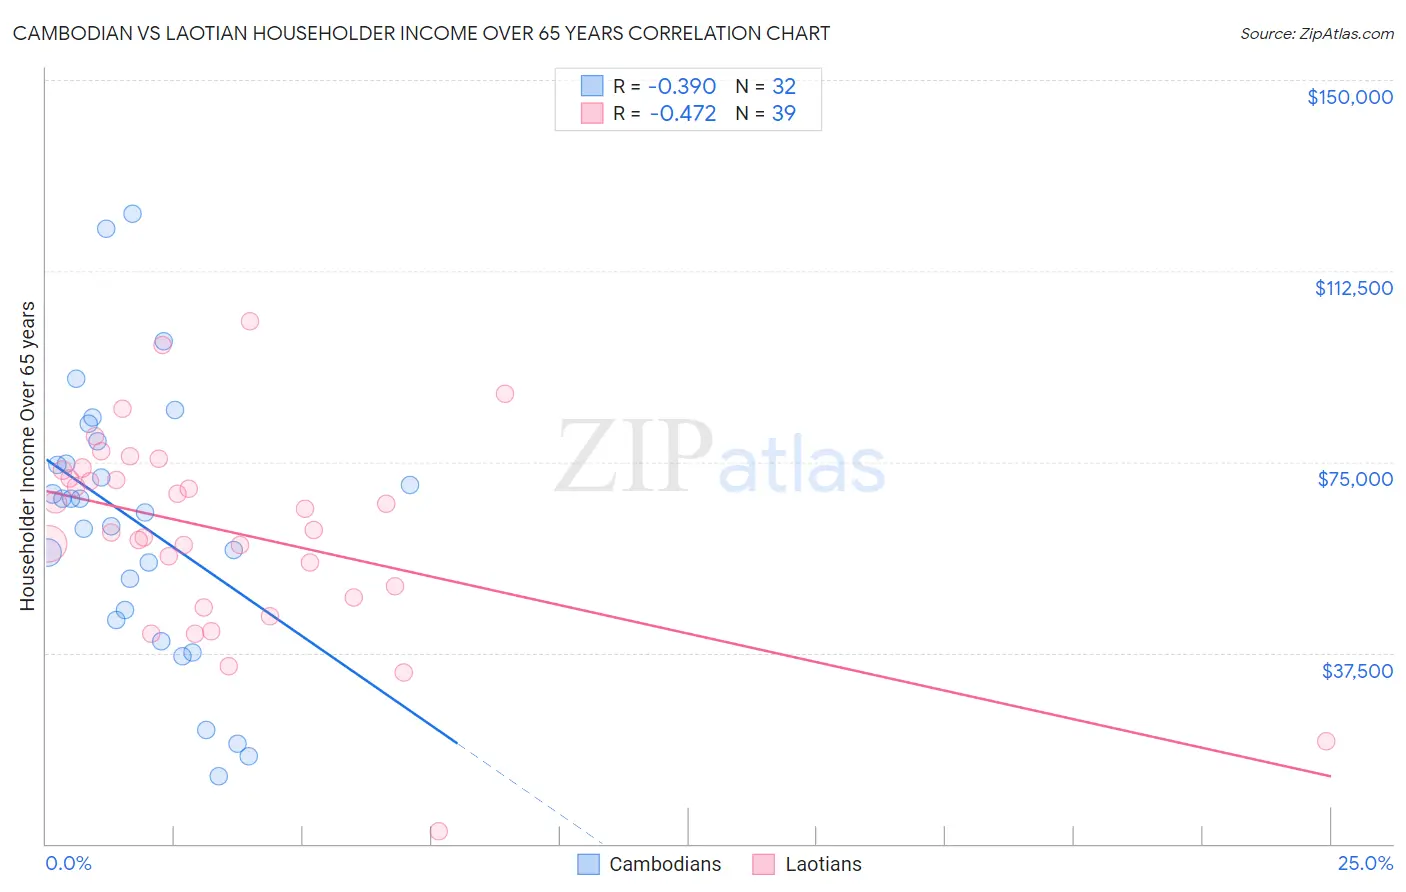
Cambodian vs Laotian Householder Income Over 65 years Correlation Chart
The statistical analysis conducted on geographies consisting of 102,372,212 people shows a mild negative correlation between the proportion of Cambodians and household income with householder over the age of 65 in the United States with a correlation coefficient (R) of -0.390 and weighted average of $66,892. Similarly, the statistical analysis conducted on geographies consisting of 224,427,715 people shows a moderate negative correlation between the proportion of Laotians and household income with householder over the age of 65 in the United States with a correlation coefficient (R) of -0.472 and weighted average of $66,306, a difference of 0.88%.
Householder Income Over 65 years Correlation Summary
| Measurement | Cambodian | Laotian |
| Minimum | $13,250 | $2,499 |
| Maximum | $123,750 | $102,679 |
| Range | $110,500 | $100,180 |
| Mean | $63,009 | $61,254 |
| Median | $66,420 | $61,648 |
| Interquartile 25% (IQ1) | $44,945 | $48,484 |
| Interquartile 75% (IQ3) | $76,799 | $73,311 |
| Interquartile Range (IQR) | $31,853 | $24,827 |
| Standard Deviation (Sample) | $26,681 | $19,839 |
| Standard Deviation (Population) | $26,261 | $19,583 |
Demographics Similar to Cambodians and Laotians by Householder Income Over 65 years
In terms of householder income over 65 years, the demographic groups most similar to Cambodians are Australian ($66,891, a difference of 0.0%), Immigrants from France ($66,826, a difference of 0.10%), Immigrants from Afghanistan ($67,007, a difference of 0.17%), Immigrants from Indonesia ($66,694, a difference of 0.30%), and Immigrants from Turkey ($66,672, a difference of 0.33%). Similarly, the demographic groups most similar to Laotians are Immigrants from Czechoslovakia ($66,376, a difference of 0.11%), Bulgarian ($66,236, a difference of 0.11%), Immigrants from Philippines ($66,161, a difference of 0.22%), Immigrants from Netherlands ($66,463, a difference of 0.24%), and Immigrants from Norway ($66,118, a difference of 0.28%).
| Demographics | Rating | Rank | Householder Income Over 65 years |
| Koreans | 99.9 /100 | #41 | Exceptional $67,472 |
| New Zealanders | 99.9 /100 | #42 | Exceptional $67,333 |
| Latvians | 99.9 /100 | #43 | Exceptional $67,326 |
| Immigrants | South Africa | 99.9 /100 | #44 | Exceptional $67,234 |
| Immigrants | Afghanistan | 99.8 /100 | #45 | Exceptional $67,007 |
| Cambodians | 99.8 /100 | #46 | Exceptional $66,892 |
| Australians | 99.8 /100 | #47 | Exceptional $66,891 |
| Immigrants | France | 99.8 /100 | #48 | Exceptional $66,826 |
| Immigrants | Indonesia | 99.8 /100 | #49 | Exceptional $66,694 |
| Immigrants | Turkey | 99.7 /100 | #50 | Exceptional $66,672 |
| Israelis | 99.7 /100 | #51 | Exceptional $66,636 |
| Immigrants | Scotland | 99.7 /100 | #52 | Exceptional $66,620 |
| Immigrants | Pakistan | 99.7 /100 | #53 | Exceptional $66,617 |
| Immigrants | Netherlands | 99.7 /100 | #54 | Exceptional $66,463 |
| Immigrants | Czechoslovakia | 99.7 /100 | #55 | Exceptional $66,376 |
| Laotians | 99.6 /100 | #56 | Exceptional $66,306 |
| Bulgarians | 99.6 /100 | #57 | Exceptional $66,236 |
| Immigrants | Philippines | 99.6 /100 | #58 | Exceptional $66,161 |
| Immigrants | Norway | 99.5 /100 | #59 | Exceptional $66,118 |
| Immigrants | Lithuania | 99.5 /100 | #60 | Exceptional $66,087 |
| Maltese | 99.5 /100 | #61 | Exceptional $66,027 |