Liberian vs Laotian Average Family Size
COMPARE
Liberian
Laotian
Average Family Size
Average Family Size Comparison
Liberians
Laotians
3.25
AVERAGE FAMILY SIZE
81.2/ 100
METRIC RATING
142nd/ 347
METRIC RANK
3.26
AVERAGE FAMILY SIZE
88.5/ 100
METRIC RATING
130th/ 347
METRIC RANK
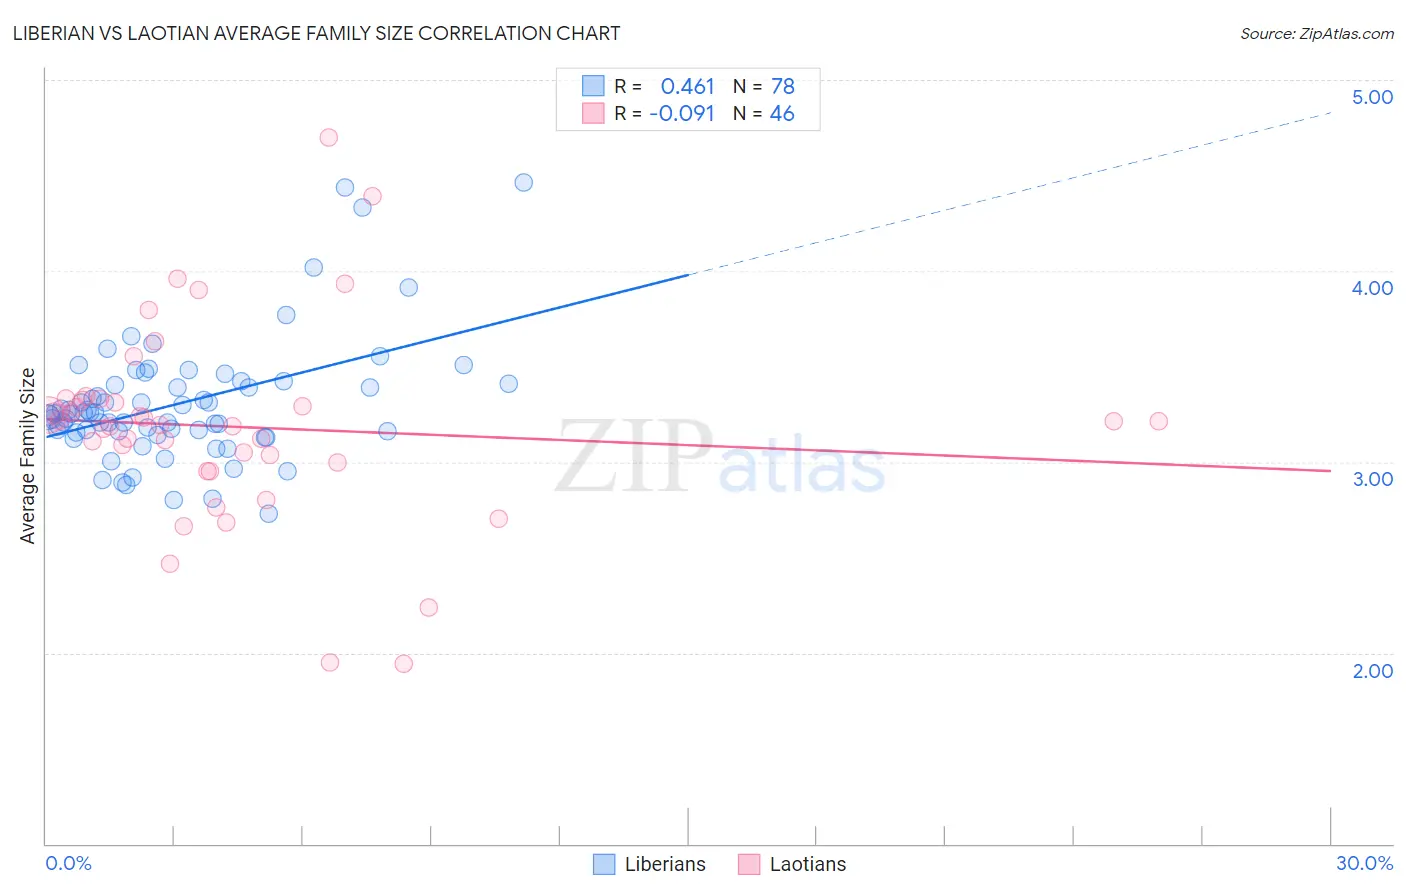
Liberian vs Laotian Average Family Size Correlation Chart
The statistical analysis conducted on geographies consisting of 118,032,364 people shows a moderate positive correlation between the proportion of Liberians and average family size in the United States with a correlation coefficient (R) of 0.461 and weighted average of 3.25. Similarly, the statistical analysis conducted on geographies consisting of 224,743,344 people shows a slight negative correlation between the proportion of Laotians and average family size in the United States with a correlation coefficient (R) of -0.091 and weighted average of 3.26, a difference of 0.26%.
Average Family Size Correlation Summary
| Measurement | Liberian | Laotian |
| Minimum | 2.73 | 1.94 |
| Maximum | 4.46 | 4.70 |
| Range | 1.73 | 2.76 |
| Mean | 3.30 | 3.18 |
| Median | 3.25 | 3.20 |
| Interquartile 25% (IQ1) | 3.16 | 3.00 |
| Interquartile 75% (IQ3) | 3.41 | 3.32 |
| Interquartile Range (IQR) | 0.25 | 0.32 |
| Standard Deviation (Sample) | 0.32 | 0.52 |
| Standard Deviation (Population) | 0.32 | 0.51 |
Demographics Similar to Liberians and Laotians by Average Family Size
In terms of average family size, the demographic groups most similar to Liberians are Immigrants from Ethiopia (3.25, a difference of 0.010%), Subsaharan African (3.25, a difference of 0.010%), Venezuelan (3.25, a difference of 0.010%), Bhutanese (3.25, a difference of 0.010%), and Cuban (3.25, a difference of 0.020%). Similarly, the demographic groups most similar to Laotians are Immigrants from Hong Kong (3.26, a difference of 0.010%), Immigrants from Western Asia (3.26, a difference of 0.030%), Colombian (3.26, a difference of 0.060%), Costa Rican (3.26, a difference of 0.070%), and Immigrants from Venezuela (3.26, a difference of 0.090%).
| Demographics | Rating | Rank | Average Family Size |
| Immigrants | Costa Rica | 90.7 /100 | #126 | Exceptional 3.26 |
| Immigrants | Syria | 90.6 /100 | #127 | Exceptional 3.26 |
| Colombians | 89.9 /100 | #128 | Excellent 3.26 |
| Immigrants | Hong Kong | 88.6 /100 | #129 | Excellent 3.26 |
| Laotians | 88.5 /100 | #130 | Excellent 3.26 |
| Immigrants | Western Asia | 87.7 /100 | #131 | Excellent 3.26 |
| Costa Ricans | 86.8 /100 | #132 | Excellent 3.26 |
| Immigrants | Venezuela | 86.3 /100 | #133 | Excellent 3.26 |
| Africans | 84.9 /100 | #134 | Excellent 3.25 |
| Panamanians | 84.2 /100 | #135 | Excellent 3.25 |
| Comanche | 82.8 /100 | #136 | Excellent 3.25 |
| Immigrants | Middle Africa | 82.4 /100 | #137 | Excellent 3.25 |
| Cubans | 81.8 /100 | #138 | Excellent 3.25 |
| Immigrants | Ethiopia | 81.6 /100 | #139 | Excellent 3.25 |
| Sub-Saharan Africans | 81.6 /100 | #140 | Excellent 3.25 |
| Venezuelans | 81.4 /100 | #141 | Excellent 3.25 |
| Liberians | 81.2 /100 | #142 | Excellent 3.25 |
| Bhutanese | 81.0 /100 | #143 | Excellent 3.25 |
| Tsimshian | 80.2 /100 | #144 | Excellent 3.25 |
| Armenians | 78.2 /100 | #145 | Good 3.25 |
| Immigrants | Africa | 77.9 /100 | #146 | Good 3.25 |