Immigrants from Trinidad and Tobago vs Laotian Average Family Size
COMPARE
Immigrants from Trinidad and Tobago
Laotian
Average Family Size
Average Family Size Comparison
Immigrants from Trinidad and Tobago
Laotians
3.33
AVERAGE FAMILY SIZE
99.9/ 100
METRIC RATING
70th/ 347
METRIC RANK
3.26
AVERAGE FAMILY SIZE
88.5/ 100
METRIC RATING
130th/ 347
METRIC RANK
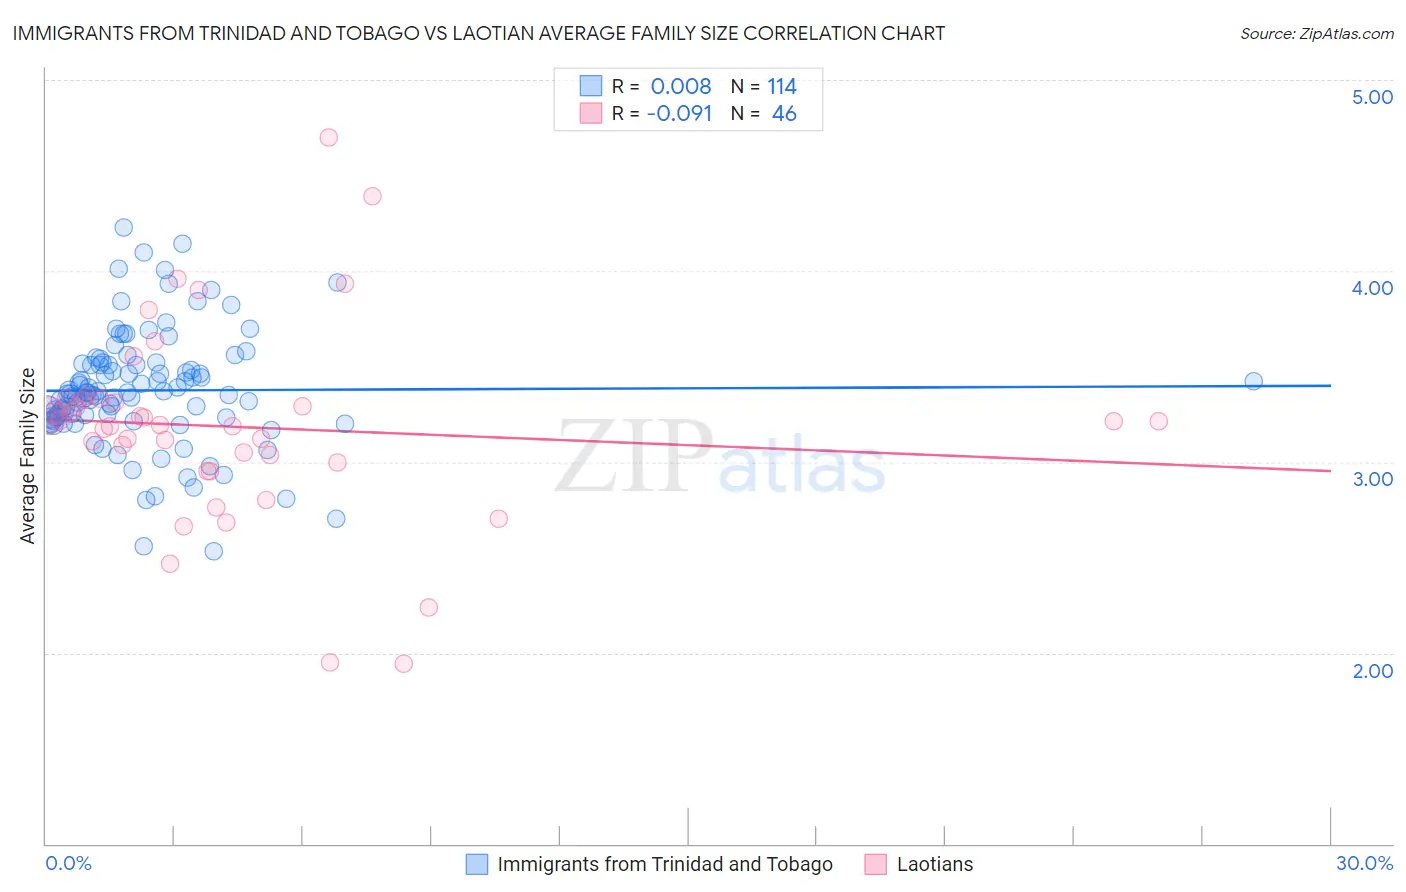
Immigrants from Trinidad and Tobago vs Laotian Average Family Size Correlation Chart
The statistical analysis conducted on geographies consisting of 223,484,407 people shows no correlation between the proportion of Immigrants from Trinidad and Tobago and average family size in the United States with a correlation coefficient (R) of 0.008 and weighted average of 3.33. Similarly, the statistical analysis conducted on geographies consisting of 224,743,344 people shows a slight negative correlation between the proportion of Laotians and average family size in the United States with a correlation coefficient (R) of -0.091 and weighted average of 3.26, a difference of 2.1%.
Average Family Size Correlation Summary
| Measurement | Immigrants from Trinidad and Tobago | Laotian |
| Minimum | 2.53 | 1.94 |
| Maximum | 4.23 | 4.70 |
| Range | 1.70 | 2.76 |
| Mean | 3.37 | 3.18 |
| Median | 3.36 | 3.20 |
| Interquartile 25% (IQ1) | 3.23 | 3.00 |
| Interquartile 75% (IQ3) | 3.51 | 3.32 |
| Interquartile Range (IQR) | 0.28 | 0.32 |
| Standard Deviation (Sample) | 0.30 | 0.52 |
| Standard Deviation (Population) | 0.30 | 0.51 |
Similar Demographics by Average Family Size
Demographics Similar to Immigrants from Trinidad and Tobago by Average Family Size
In terms of average family size, the demographic groups most similar to Immigrants from Trinidad and Tobago are Immigrants from West Indies (3.33, a difference of 0.010%), Immigrants (3.33, a difference of 0.050%), Immigrants from Cambodia (3.33, a difference of 0.080%), Immigrants from Caribbean (3.33, a difference of 0.080%), and Yaqui (3.32, a difference of 0.11%).
| Demographics | Rating | Rank | Average Family Size |
| Chinese | 100.0 /100 | #63 | Exceptional 3.34 |
| Dominicans | 99.9 /100 | #64 | Exceptional 3.34 |
| Immigrants | Laos | 99.9 /100 | #65 | Exceptional 3.34 |
| Immigrants | St. Vincent and the Grenadines | 99.9 /100 | #66 | Exceptional 3.34 |
| Immigrants | Jamaica | 99.9 /100 | #67 | Exceptional 3.33 |
| Immigrants | Cambodia | 99.9 /100 | #68 | Exceptional 3.33 |
| Immigrants | Immigrants | 99.9 /100 | #69 | Exceptional 3.33 |
| Immigrants | Trinidad and Tobago | 99.9 /100 | #70 | Exceptional 3.33 |
| Immigrants | West Indies | 99.9 /100 | #71 | Exceptional 3.33 |
| Immigrants | Caribbean | 99.9 /100 | #72 | Exceptional 3.33 |
| Yaqui | 99.9 /100 | #73 | Exceptional 3.32 |
| Immigrants | Sierra Leone | 99.9 /100 | #74 | Exceptional 3.32 |
| Immigrants | Barbados | 99.8 /100 | #75 | Exceptional 3.32 |
| Trinidadians and Tobagonians | 99.8 /100 | #76 | Exceptional 3.32 |
| Immigrants | Ecuador | 99.8 /100 | #77 | Exceptional 3.32 |
Demographics Similar to Laotians by Average Family Size
In terms of average family size, the demographic groups most similar to Laotians are Immigrants from Hong Kong (3.26, a difference of 0.010%), Immigrants from Western Asia (3.26, a difference of 0.030%), Colombian (3.26, a difference of 0.060%), Costa Rican (3.26, a difference of 0.070%), and Immigrants from Venezuela (3.26, a difference of 0.090%).
| Demographics | Rating | Rank | Average Family Size |
| Alaskan Athabascans | 92.4 /100 | #123 | Exceptional 3.27 |
| South American Indians | 91.6 /100 | #124 | Exceptional 3.26 |
| Immigrants | Cuba | 91.3 /100 | #125 | Exceptional 3.26 |
| Immigrants | Costa Rica | 90.7 /100 | #126 | Exceptional 3.26 |
| Immigrants | Syria | 90.6 /100 | #127 | Exceptional 3.26 |
| Colombians | 89.9 /100 | #128 | Excellent 3.26 |
| Immigrants | Hong Kong | 88.6 /100 | #129 | Excellent 3.26 |
| Laotians | 88.5 /100 | #130 | Excellent 3.26 |
| Immigrants | Western Asia | 87.7 /100 | #131 | Excellent 3.26 |
| Costa Ricans | 86.8 /100 | #132 | Excellent 3.26 |
| Immigrants | Venezuela | 86.3 /100 | #133 | Excellent 3.26 |
| Africans | 84.9 /100 | #134 | Excellent 3.25 |
| Panamanians | 84.2 /100 | #135 | Excellent 3.25 |
| Comanche | 82.8 /100 | #136 | Excellent 3.25 |
| Immigrants | Middle Africa | 82.4 /100 | #137 | Excellent 3.25 |