Cambodian vs Laotian Currently Married
COMPARE
Cambodian
Laotian
Currently Married
Currently Married Comparison
Cambodians
Laotians
47.0%
CURRENTLY MARRIED
70.4/ 100
METRIC RATING
148th/ 347
METRIC RANK
47.4%
CURRENTLY MARRIED
86.6/ 100
METRIC RATING
124th/ 347
METRIC RANK
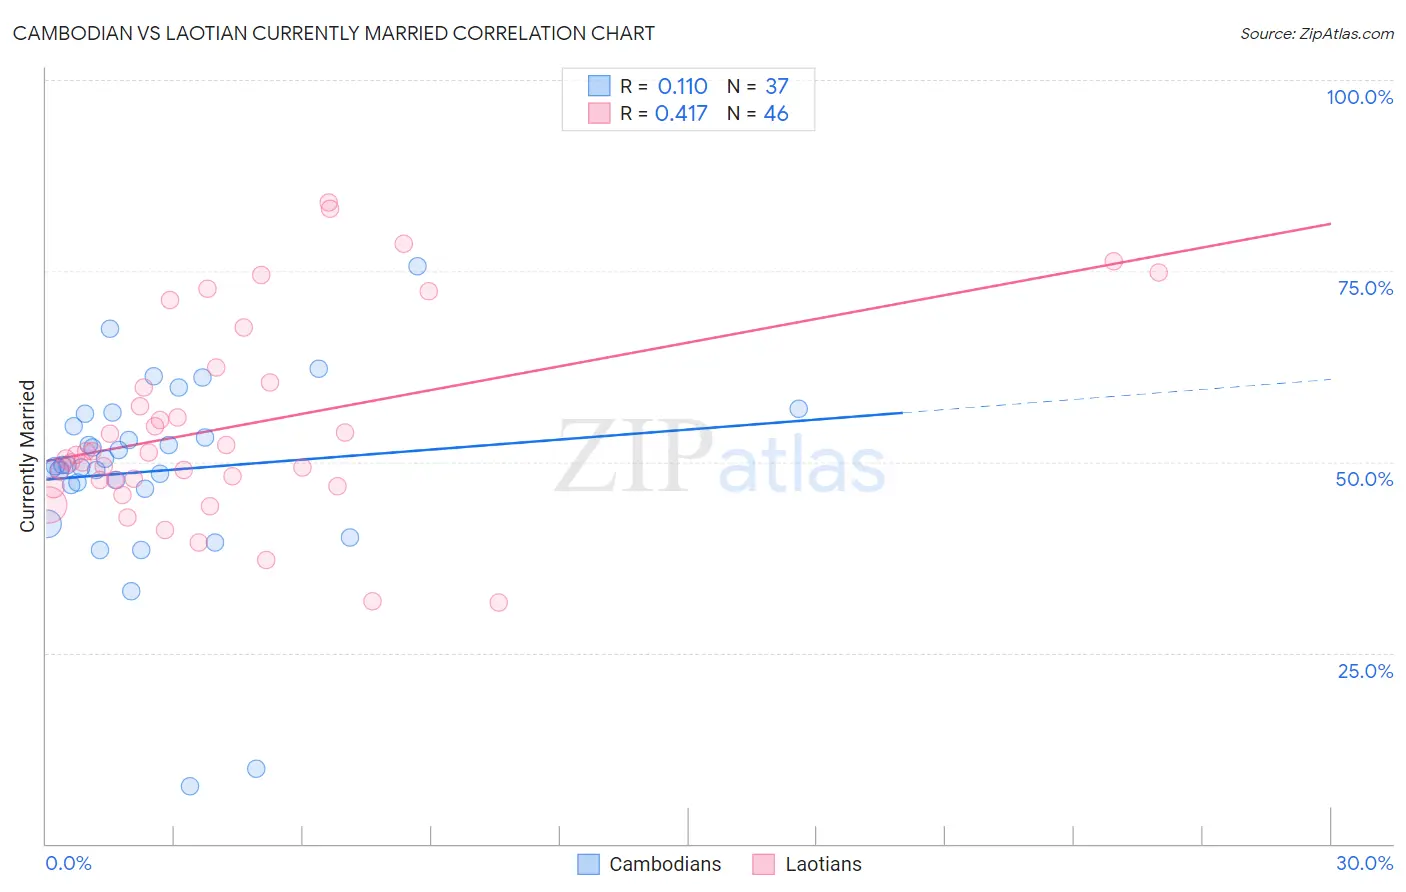
Cambodian vs Laotian Currently Married Correlation Chart
The statistical analysis conducted on geographies consisting of 102,515,172 people shows a poor positive correlation between the proportion of Cambodians and percentage of population currently married in the United States with a correlation coefficient (R) of 0.110 and weighted average of 47.0%. Similarly, the statistical analysis conducted on geographies consisting of 224,816,761 people shows a moderate positive correlation between the proportion of Laotians and percentage of population currently married in the United States with a correlation coefficient (R) of 0.417 and weighted average of 47.4%, a difference of 0.91%.
Currently Married Correlation Summary
| Measurement | Cambodian | Laotian |
| Minimum | 7.6% | 31.6% |
| Maximum | 75.6% | 83.9% |
| Range | 68.0% | 52.3% |
| Mean | 48.8% | 54.7% |
| Median | 49.5% | 51.1% |
| Interquartile 25% (IQ1) | 46.7% | 47.6% |
| Interquartile 75% (IQ3) | 55.5% | 60.4% |
| Interquartile Range (IQR) | 8.8% | 12.7% |
| Standard Deviation (Sample) | 12.8% | 12.9% |
| Standard Deviation (Population) | 12.6% | 12.8% |
Similar Demographics by Currently Married
Demographics Similar to Cambodians by Currently Married
In terms of currently married, the demographic groups most similar to Cambodians are Zimbabwean (47.0%, a difference of 0.010%), Immigrants from Turkey (47.0%, a difference of 0.010%), Chilean (47.0%, a difference of 0.030%), Immigrants from Argentina (47.0%, a difference of 0.070%), and Immigrants from Serbia (47.0%, a difference of 0.070%).
| Demographics | Rating | Rank | Currently Married |
| Venezuelans | 74.4 /100 | #141 | Good 47.1% |
| Argentineans | 74.4 /100 | #142 | Good 47.1% |
| Guamanians/Chamorros | 74.2 /100 | #143 | Good 47.1% |
| Hmong | 73.4 /100 | #144 | Good 47.1% |
| Immigrants | South Eastern Asia | 72.9 /100 | #145 | Good 47.1% |
| Carpatho Rusyns | 72.6 /100 | #146 | Good 47.0% |
| Immigrants | Argentina | 72.0 /100 | #147 | Good 47.0% |
| Cambodians | 70.4 /100 | #148 | Good 47.0% |
| Zimbabweans | 70.1 /100 | #149 | Good 47.0% |
| Immigrants | Turkey | 70.0 /100 | #150 | Good 47.0% |
| Chileans | 69.8 /100 | #151 | Good 47.0% |
| Immigrants | Serbia | 68.8 /100 | #152 | Good 47.0% |
| Immigrants | Venezuela | 68.6 /100 | #153 | Good 47.0% |
| Albanians | 68.6 /100 | #154 | Good 47.0% |
| Arabs | 68.6 /100 | #155 | Good 47.0% |
Demographics Similar to Laotians by Currently Married
In terms of currently married, the demographic groups most similar to Laotians are Immigrants from Kazakhstan (47.4%, a difference of 0.050%), Okinawan (47.4%, a difference of 0.10%), Osage (47.5%, a difference of 0.11%), Immigrants from Jordan (47.4%, a difference of 0.13%), and New Zealander (47.4%, a difference of 0.13%).
| Demographics | Rating | Rank | Currently Married |
| Puget Sound Salish | 90.3 /100 | #117 | Exceptional 47.6% |
| Immigrants | Philippines | 90.2 /100 | #118 | Exceptional 47.6% |
| Australians | 90.2 /100 | #119 | Exceptional 47.6% |
| Syrians | 88.9 /100 | #120 | Excellent 47.5% |
| Immigrants | Croatia | 88.6 /100 | #121 | Excellent 47.5% |
| Osage | 87.9 /100 | #122 | Excellent 47.5% |
| Immigrants | Kazakhstan | 87.2 /100 | #123 | Excellent 47.4% |
| Laotians | 86.6 /100 | #124 | Excellent 47.4% |
| Okinawans | 85.3 /100 | #125 | Excellent 47.4% |
| Immigrants | Jordan | 84.9 /100 | #126 | Excellent 47.4% |
| New Zealanders | 84.9 /100 | #127 | Excellent 47.4% |
| Portuguese | 84.2 /100 | #128 | Excellent 47.3% |
| Sri Lankans | 83.2 /100 | #129 | Excellent 47.3% |
| Immigrants | Iraq | 82.8 /100 | #130 | Excellent 47.3% |
| Icelanders | 82.4 /100 | #131 | Excellent 47.3% |