Taiwanese vs Laotian Average Family Size
COMPARE
Taiwanese
Laotian
Average Family Size
Average Family Size Comparison
Taiwanese
Laotians
3.23
AVERAGE FAMILY SIZE
54.2/ 100
METRIC RATING
168th/ 347
METRIC RANK
3.26
AVERAGE FAMILY SIZE
88.5/ 100
METRIC RATING
130th/ 347
METRIC RANK
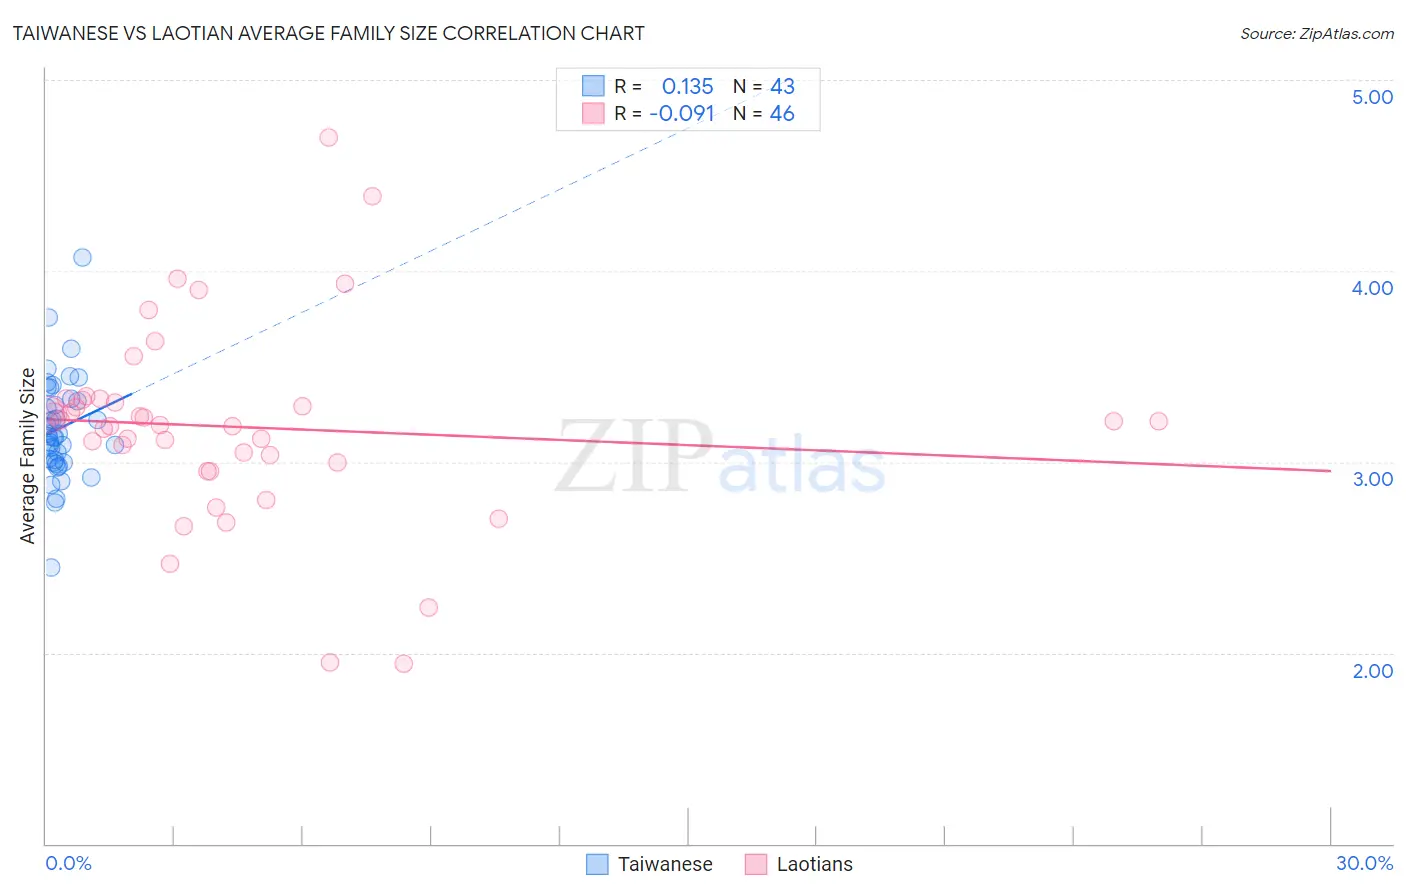
Taiwanese vs Laotian Average Family Size Correlation Chart
The statistical analysis conducted on geographies consisting of 31,668,405 people shows a poor positive correlation between the proportion of Taiwanese and average family size in the United States with a correlation coefficient (R) of 0.135 and weighted average of 3.23. Similarly, the statistical analysis conducted on geographies consisting of 224,743,344 people shows a slight negative correlation between the proportion of Laotians and average family size in the United States with a correlation coefficient (R) of -0.091 and weighted average of 3.26, a difference of 0.85%.
Average Family Size Correlation Summary
| Measurement | Taiwanese | Laotian |
| Minimum | 2.45 | 1.94 |
| Maximum | 4.07 | 4.70 |
| Range | 1.62 | 2.76 |
| Mean | 3.18 | 3.18 |
| Median | 3.13 | 3.20 |
| Interquartile 25% (IQ1) | 3.00 | 3.00 |
| Interquartile 75% (IQ3) | 3.33 | 3.32 |
| Interquartile Range (IQR) | 0.33 | 0.32 |
| Standard Deviation (Sample) | 0.27 | 0.52 |
| Standard Deviation (Population) | 0.27 | 0.51 |
Similar Demographics by Average Family Size
Demographics Similar to Taiwanese by Average Family Size
In terms of average family size, the demographic groups most similar to Taiwanese are Aleut (3.23, a difference of 0.0%), Arab (3.23, a difference of 0.010%), Chilean (3.23, a difference of 0.020%), Immigrants from Congo (3.23, a difference of 0.030%), and Immigrants from Uruguay (3.23, a difference of 0.040%).
| Demographics | Rating | Rank | Average Family Size |
| Immigrants | Chile | 63.2 /100 | #161 | Good 3.24 |
| Immigrants | Uganda | 60.1 /100 | #162 | Good 3.23 |
| Uruguayans | 58.8 /100 | #163 | Average 3.23 |
| Egyptians | 58.6 /100 | #164 | Average 3.23 |
| Ugandans | 58.4 /100 | #165 | Average 3.23 |
| Immigrants | Senegal | 57.5 /100 | #166 | Average 3.23 |
| Dutch West Indians | 56.9 /100 | #167 | Average 3.23 |
| Taiwanese | 54.2 /100 | #168 | Average 3.23 |
| Aleuts | 54.1 /100 | #169 | Average 3.23 |
| Arabs | 53.8 /100 | #170 | Average 3.23 |
| Chileans | 53.2 /100 | #171 | Average 3.23 |
| Immigrants | Congo | 52.7 /100 | #172 | Average 3.23 |
| Immigrants | Uruguay | 52.0 /100 | #173 | Average 3.23 |
| Immigrants | South Central Asia | 50.0 /100 | #174 | Average 3.23 |
| Immigrants | China | 49.9 /100 | #175 | Average 3.23 |
Demographics Similar to Laotians by Average Family Size
In terms of average family size, the demographic groups most similar to Laotians are Immigrants from Hong Kong (3.26, a difference of 0.010%), Immigrants from Western Asia (3.26, a difference of 0.030%), Colombian (3.26, a difference of 0.060%), Costa Rican (3.26, a difference of 0.070%), and Immigrants from Venezuela (3.26, a difference of 0.090%).
| Demographics | Rating | Rank | Average Family Size |
| Alaskan Athabascans | 92.4 /100 | #123 | Exceptional 3.27 |
| South American Indians | 91.6 /100 | #124 | Exceptional 3.26 |
| Immigrants | Cuba | 91.3 /100 | #125 | Exceptional 3.26 |
| Immigrants | Costa Rica | 90.7 /100 | #126 | Exceptional 3.26 |
| Immigrants | Syria | 90.6 /100 | #127 | Exceptional 3.26 |
| Colombians | 89.9 /100 | #128 | Excellent 3.26 |
| Immigrants | Hong Kong | 88.6 /100 | #129 | Excellent 3.26 |
| Laotians | 88.5 /100 | #130 | Excellent 3.26 |
| Immigrants | Western Asia | 87.7 /100 | #131 | Excellent 3.26 |
| Costa Ricans | 86.8 /100 | #132 | Excellent 3.26 |
| Immigrants | Venezuela | 86.3 /100 | #133 | Excellent 3.26 |
| Africans | 84.9 /100 | #134 | Excellent 3.25 |
| Panamanians | 84.2 /100 | #135 | Excellent 3.25 |
| Comanche | 82.8 /100 | #136 | Excellent 3.25 |
| Immigrants | Middle Africa | 82.4 /100 | #137 | Excellent 3.25 |