Cambodian vs Immigrants from Uruguay Male Poverty
COMPARE
Cambodian
Immigrants from Uruguay
Male Poverty
Male Poverty Comparison
Cambodians
Immigrants from Uruguay
10.4%
MALE POVERTY
95.0/ 100
METRIC RATING
88th/ 347
METRIC RANK
11.6%
MALE POVERTY
19.1/ 100
METRIC RATING
192nd/ 347
METRIC RANK
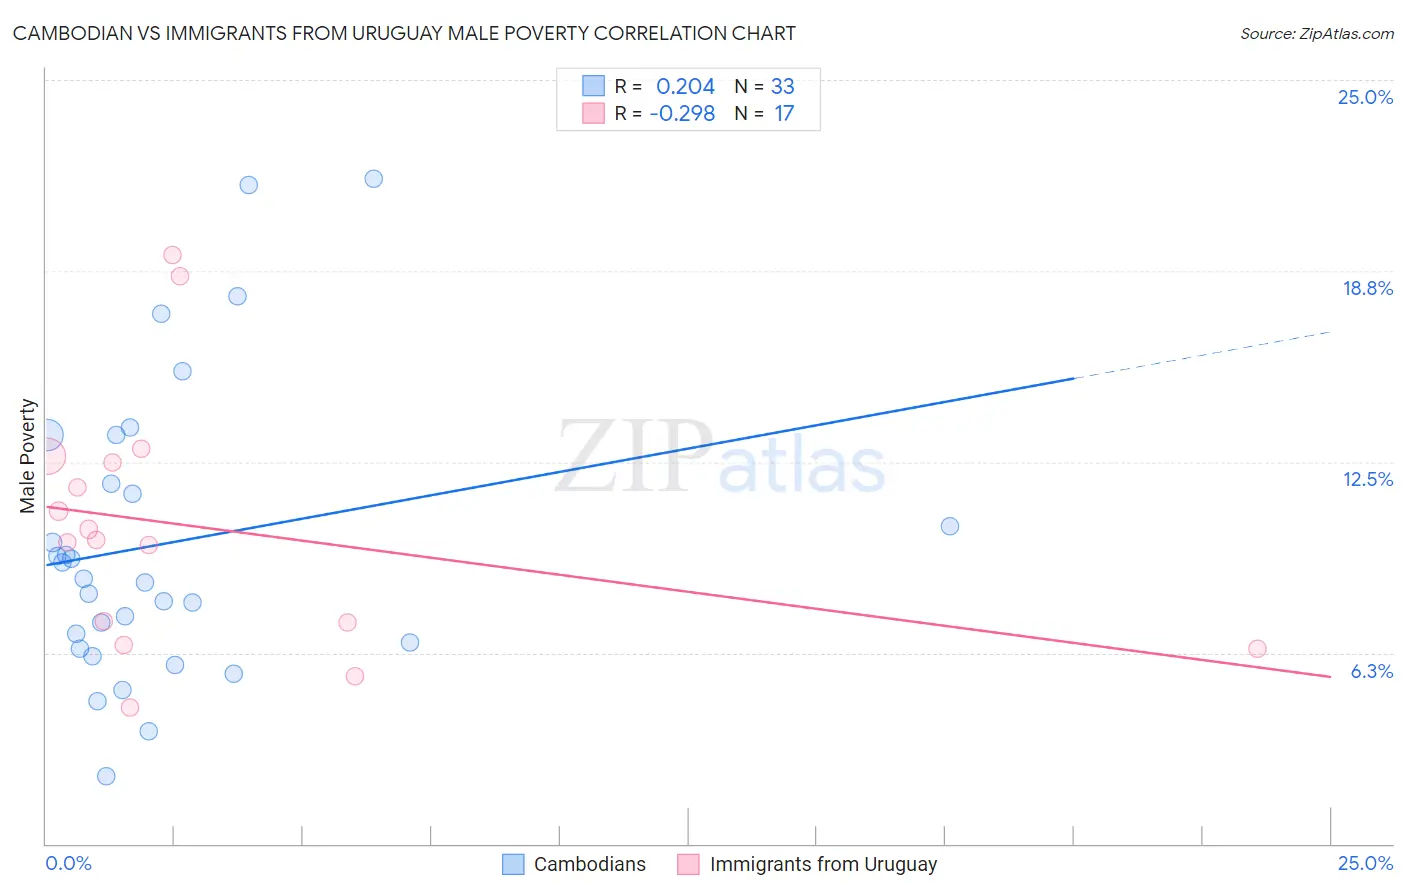
Cambodian vs Immigrants from Uruguay Male Poverty Correlation Chart
The statistical analysis conducted on geographies consisting of 102,467,050 people shows a weak positive correlation between the proportion of Cambodians and poverty level among males in the United States with a correlation coefficient (R) of 0.204 and weighted average of 10.4%. Similarly, the statistical analysis conducted on geographies consisting of 133,238,599 people shows a weak negative correlation between the proportion of Immigrants from Uruguay and poverty level among males in the United States with a correlation coefficient (R) of -0.298 and weighted average of 11.6%, a difference of 11.6%.
Male Poverty Correlation Summary
| Measurement | Cambodian | Immigrants from Uruguay |
| Minimum | 2.2% | 4.5% |
| Maximum | 21.8% | 19.3% |
| Range | 19.6% | 14.8% |
| Mean | 9.8% | 10.3% |
| Median | 8.7% | 10.0% |
| Interquartile 25% (IQ1) | 6.5% | 6.9% |
| Interquartile 75% (IQ3) | 12.6% | 12.6% |
| Interquartile Range (IQR) | 6.1% | 5.7% |
| Standard Deviation (Sample) | 4.8% | 4.1% |
| Standard Deviation (Population) | 4.7% | 4.0% |
Similar Demographics by Male Poverty
Demographics Similar to Cambodians by Male Poverty
In terms of male poverty, the demographic groups most similar to Cambodians are Immigrants from Denmark (10.4%, a difference of 0.0%), Indian (Asian) (10.4%, a difference of 0.030%), British (10.4%, a difference of 0.10%), Northern European (10.4%, a difference of 0.14%), and Immigrants from Eastern Asia (10.4%, a difference of 0.18%).
| Demographics | Rating | Rank | Male Poverty |
| Belgians | 95.9 /100 | #81 | Exceptional 10.3% |
| Egyptians | 95.9 /100 | #82 | Exceptional 10.3% |
| Immigrants | Sweden | 95.7 /100 | #83 | Exceptional 10.3% |
| Czechoslovakians | 95.6 /100 | #84 | Exceptional 10.3% |
| Immigrants | England | 95.5 /100 | #85 | Exceptional 10.4% |
| Immigrants | Eastern Asia | 95.3 /100 | #86 | Exceptional 10.4% |
| Northern Europeans | 95.2 /100 | #87 | Exceptional 10.4% |
| Cambodians | 95.0 /100 | #88 | Exceptional 10.4% |
| Immigrants | Denmark | 95.0 /100 | #89 | Exceptional 10.4% |
| Indians (Asian) | 94.9 /100 | #90 | Exceptional 10.4% |
| British | 94.8 /100 | #91 | Exceptional 10.4% |
| Jordanians | 94.4 /100 | #92 | Exceptional 10.4% |
| Australians | 94.4 /100 | #93 | Exceptional 10.4% |
| Immigrants | South Africa | 94.1 /100 | #94 | Exceptional 10.4% |
| Scottish | 94.0 /100 | #95 | Exceptional 10.4% |
Demographics Similar to Immigrants from Uruguay by Male Poverty
In terms of male poverty, the demographic groups most similar to Immigrants from Uruguay are Immigrants from Kuwait (11.6%, a difference of 0.29%), Immigrants from Kenya (11.6%, a difference of 0.50%), South American Indian (11.5%, a difference of 0.52%), Arab (11.6%, a difference of 0.55%), and Hmong (11.6%, a difference of 0.56%).
| Demographics | Rating | Rank | Male Poverty |
| Immigrants | Afghanistan | 33.3 /100 | #185 | Fair 11.4% |
| Immigrants | Sierra Leone | 32.9 /100 | #186 | Fair 11.4% |
| Immigrants | Iraq | 31.9 /100 | #187 | Fair 11.4% |
| Sierra Leoneans | 29.9 /100 | #188 | Fair 11.4% |
| Hawaiians | 28.3 /100 | #189 | Fair 11.4% |
| Israelis | 26.1 /100 | #190 | Fair 11.5% |
| South American Indians | 22.8 /100 | #191 | Fair 11.5% |
| Immigrants | Uruguay | 19.1 /100 | #192 | Poor 11.6% |
| Immigrants | Kuwait | 17.3 /100 | #193 | Poor 11.6% |
| Immigrants | Kenya | 16.1 /100 | #194 | Poor 11.6% |
| Arabs | 15.8 /100 | #195 | Poor 11.6% |
| Hmong | 15.8 /100 | #196 | Poor 11.6% |
| Delaware | 15.4 /100 | #197 | Poor 11.7% |
| Iraqis | 14.7 /100 | #198 | Poor 11.7% |
| Spanish | 14.1 /100 | #199 | Poor 11.7% |