Cambodian vs Immigrants from Uruguay 6th Grade
COMPARE
Cambodian
Immigrants from Uruguay
6th Grade
6th Grade Comparison
Cambodians
Immigrants from Uruguay
97.3%
6TH GRADE
91.8/ 100
METRIC RATING
130th/ 347
METRIC RANK
96.5%
6TH GRADE
0.6/ 100
METRIC RATING
252nd/ 347
METRIC RANK
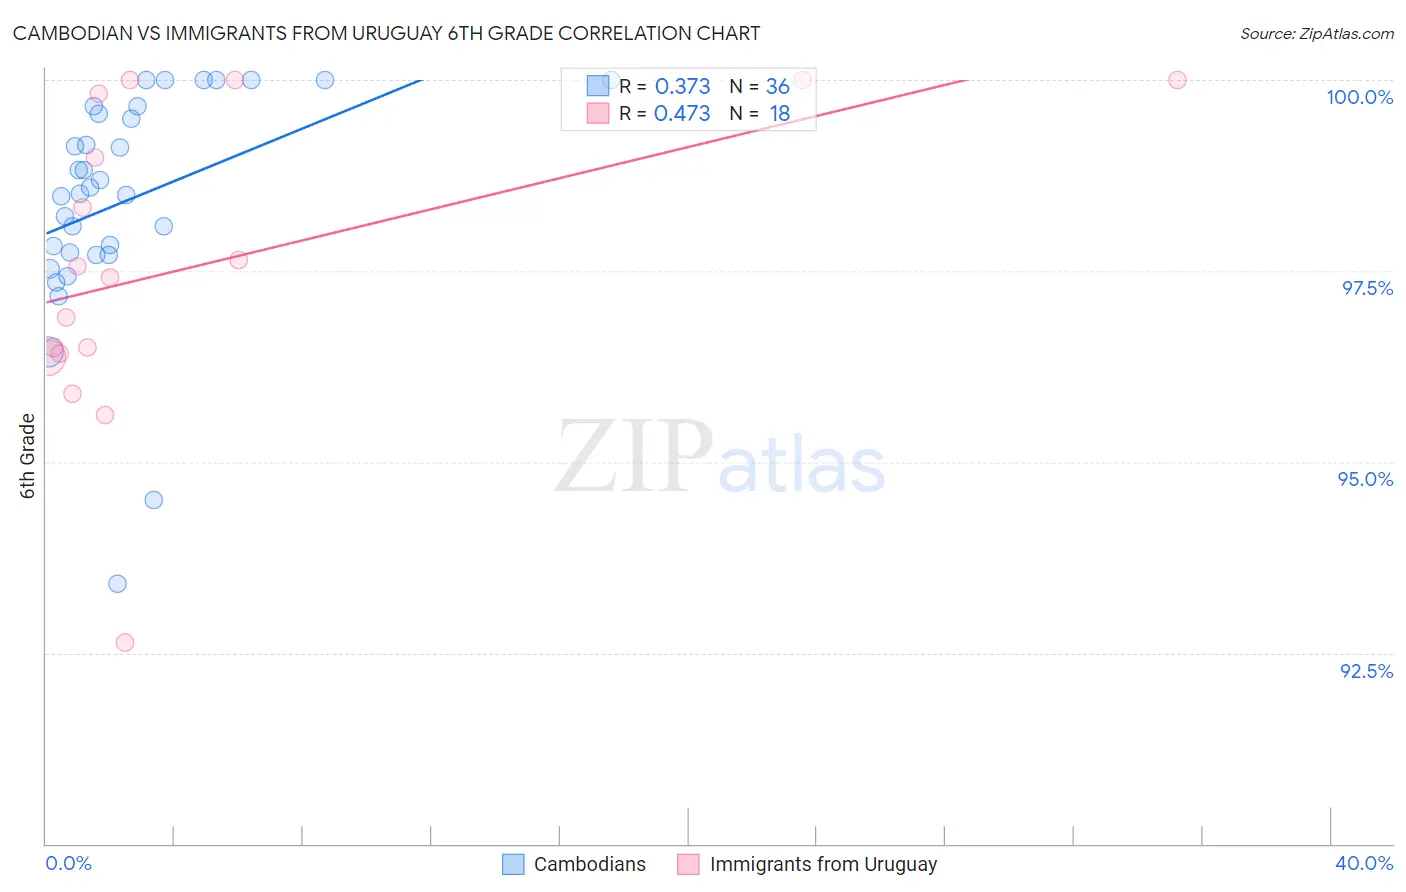
Cambodian vs Immigrants from Uruguay 6th Grade Correlation Chart
The statistical analysis conducted on geographies consisting of 102,511,743 people shows a mild positive correlation between the proportion of Cambodians and percentage of population with at least 6th grade education in the United States with a correlation coefficient (R) of 0.373 and weighted average of 97.3%. Similarly, the statistical analysis conducted on geographies consisting of 133,259,667 people shows a moderate positive correlation between the proportion of Immigrants from Uruguay and percentage of population with at least 6th grade education in the United States with a correlation coefficient (R) of 0.473 and weighted average of 96.5%, a difference of 0.86%.
6th Grade Correlation Summary
| Measurement | Cambodian | Immigrants from Uruguay |
| Minimum | 93.4% | 92.6% |
| Maximum | 100.0% | 100.0% |
| Range | 6.6% | 7.4% |
| Mean | 98.4% | 97.6% |
| Median | 98.5% | 97.5% |
| Interquartile 25% (IQ1) | 97.7% | 96.4% |
| Interquartile 75% (IQ3) | 99.6% | 99.8% |
| Interquartile Range (IQR) | 1.9% | 3.4% |
| Standard Deviation (Sample) | 1.5% | 2.0% |
| Standard Deviation (Population) | 1.5% | 1.9% |
Similar Demographics by 6th Grade
Demographics Similar to Cambodians by 6th Grade
In terms of 6th grade, the demographic groups most similar to Cambodians are Immigrants from Romania (97.3%, a difference of 0.0%), Immigrants from Serbia (97.3%, a difference of 0.0%), Immigrants from Europe (97.3%, a difference of 0.010%), Palestinian (97.3%, a difference of 0.010%), and Immigrants from Croatia (97.3%, a difference of 0.020%).
| Demographics | Rating | Rank | 6th Grade |
| Hmong | 94.4 /100 | #123 | Exceptional 97.4% |
| Okinawans | 94.2 /100 | #124 | Exceptional 97.4% |
| Spanish | 93.7 /100 | #125 | Exceptional 97.3% |
| Immigrants | Bulgaria | 93.6 /100 | #126 | Exceptional 97.3% |
| Immigrants | Croatia | 93.1 /100 | #127 | Exceptional 97.3% |
| Immigrants | Romania | 92.0 /100 | #128 | Exceptional 97.3% |
| Immigrants | Serbia | 91.9 /100 | #129 | Exceptional 97.3% |
| Cambodians | 91.8 /100 | #130 | Exceptional 97.3% |
| Immigrants | Europe | 91.1 /100 | #131 | Exceptional 97.3% |
| Palestinians | 90.9 /100 | #132 | Exceptional 97.3% |
| Immigrants | Moldova | 90.0 /100 | #133 | Excellent 97.3% |
| Immigrants | Kuwait | 89.5 /100 | #134 | Excellent 97.3% |
| Immigrants | Hungary | 89.5 /100 | #135 | Excellent 97.3% |
| Filipinos | 88.9 /100 | #136 | Excellent 97.3% |
| Burmese | 87.8 /100 | #137 | Excellent 97.3% |
Demographics Similar to Immigrants from Uruguay by 6th Grade
In terms of 6th grade, the demographic groups most similar to Immigrants from Uruguay are Immigrants from Senegal (96.5%, a difference of 0.010%), Jamaican (96.5%, a difference of 0.010%), Immigrants from Ethiopia (96.5%, a difference of 0.010%), Immigrants from Congo (96.5%, a difference of 0.010%), and Immigrants from Middle Africa (96.5%, a difference of 0.020%).
| Demographics | Rating | Rank | 6th Grade |
| Immigrants | Costa Rica | 1.3 /100 | #245 | Tragic 96.6% |
| Immigrants | Africa | 1.3 /100 | #246 | Tragic 96.6% |
| Bolivians | 1.0 /100 | #247 | Tragic 96.5% |
| Tohono O'odham | 1.0 /100 | #248 | Tragic 96.5% |
| Colombians | 0.9 /100 | #249 | Tragic 96.5% |
| Immigrants | Middle Africa | 0.8 /100 | #250 | Tragic 96.5% |
| Immigrants | Senegal | 0.7 /100 | #251 | Tragic 96.5% |
| Immigrants | Uruguay | 0.6 /100 | #252 | Tragic 96.5% |
| Jamaicans | 0.6 /100 | #253 | Tragic 96.5% |
| Immigrants | Ethiopia | 0.6 /100 | #254 | Tragic 96.5% |
| Immigrants | Congo | 0.6 /100 | #255 | Tragic 96.5% |
| U.S. Virgin Islanders | 0.5 /100 | #256 | Tragic 96.5% |
| Taiwanese | 0.5 /100 | #257 | Tragic 96.5% |
| Immigrants | China | 0.4 /100 | #258 | Tragic 96.4% |
| South Americans | 0.4 /100 | #259 | Tragic 96.4% |