Cambodian vs Immigrants from Uruguay In Labor Force | Age 20-24
COMPARE
Cambodian
Immigrants from Uruguay
In Labor Force | Age 20-24
In Labor Force | Age 20-24 Comparison
Cambodians
Immigrants from Uruguay
75.2%
IN LABOR FORCE | AGE 20-24
60.5/ 100
METRIC RATING
166th/ 347
METRIC RANK
74.6%
IN LABOR FORCE | AGE 20-24
15.8/ 100
METRIC RATING
208th/ 347
METRIC RANK
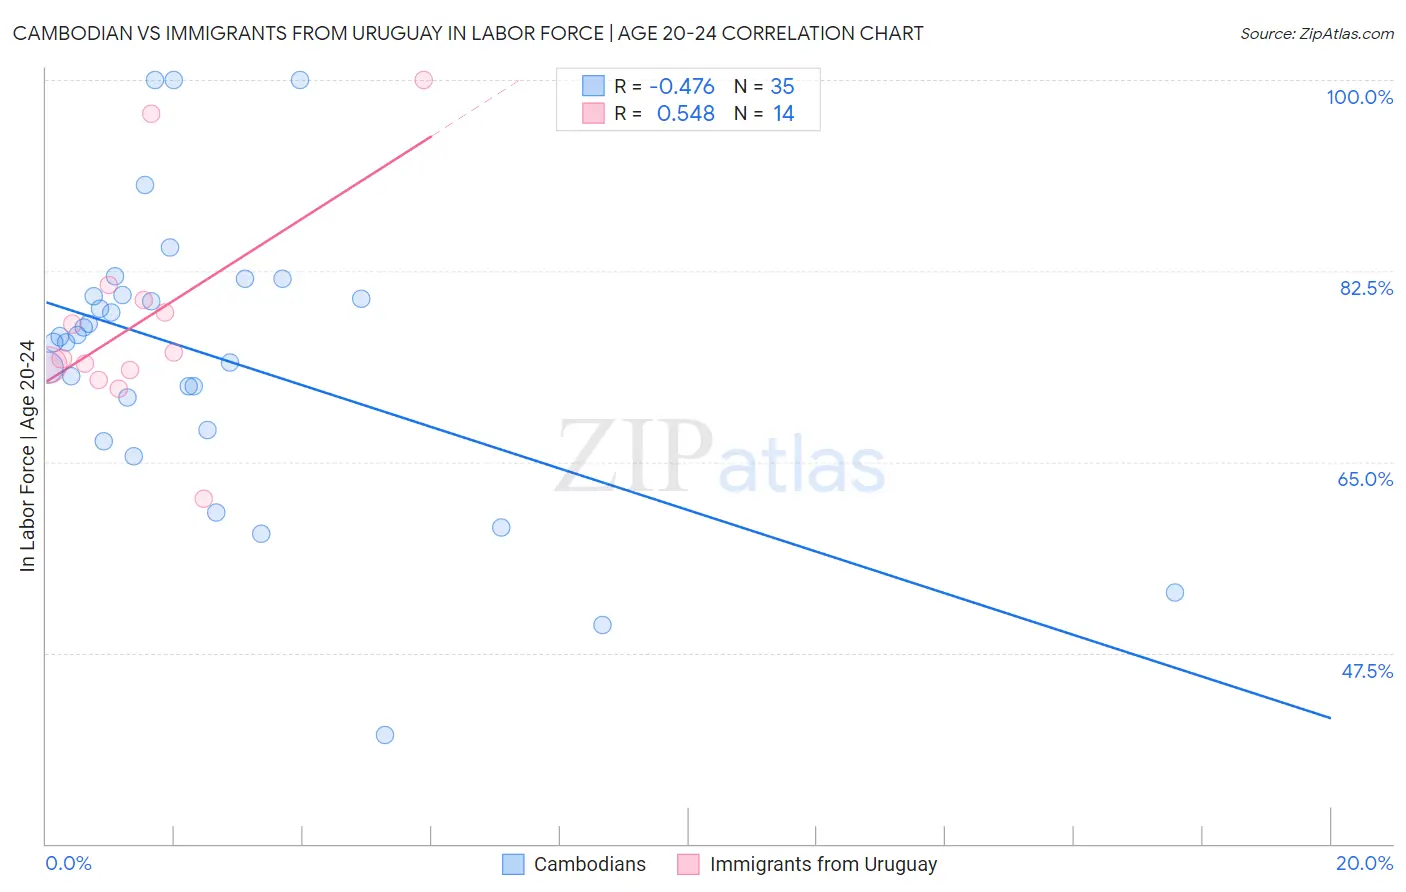
Cambodian vs Immigrants from Uruguay In Labor Force | Age 20-24 Correlation Chart
The statistical analysis conducted on geographies consisting of 102,513,868 people shows a moderate negative correlation between the proportion of Cambodians and labor force participation rate among population between the ages 20 and 24 in the United States with a correlation coefficient (R) of -0.476 and weighted average of 75.2%. Similarly, the statistical analysis conducted on geographies consisting of 133,248,800 people shows a substantial positive correlation between the proportion of Immigrants from Uruguay and labor force participation rate among population between the ages 20 and 24 in the United States with a correlation coefficient (R) of 0.548 and weighted average of 74.6%, a difference of 0.77%.
In Labor Force | Age 20-24 Correlation Summary
| Measurement | Cambodian | Immigrants from Uruguay |
| Minimum | 40.0% | 61.6% |
| Maximum | 100.0% | 100.0% |
| Range | 60.0% | 38.4% |
| Mean | 74.7% | 77.9% |
| Median | 76.5% | 74.8% |
| Interquartile 25% (IQ1) | 68.0% | 73.5% |
| Interquartile 75% (IQ3) | 80.3% | 79.9% |
| Interquartile Range (IQR) | 12.4% | 6.4% |
| Standard Deviation (Sample) | 13.1% | 9.9% |
| Standard Deviation (Population) | 12.9% | 9.5% |
Similar Demographics by In Labor Force | Age 20-24
Demographics Similar to Cambodians by In Labor Force | Age 20-24
In terms of in labor force | age 20-24, the demographic groups most similar to Cambodians are Immigrants from South Eastern Asia (75.1%, a difference of 0.040%), Bolivian (75.2%, a difference of 0.050%), Afghan (75.2%, a difference of 0.050%), Immigrants from Romania (75.2%, a difference of 0.060%), and Costa Rican (75.2%, a difference of 0.060%).
| Demographics | Rating | Rank | In Labor Force | Age 20-24 |
| South American Indians | 69.0 /100 | #159 | Good 75.3% |
| Japanese | 68.7 /100 | #160 | Good 75.3% |
| New Zealanders | 65.4 /100 | #161 | Good 75.2% |
| Immigrants | Romania | 64.6 /100 | #162 | Good 75.2% |
| Costa Ricans | 64.2 /100 | #163 | Good 75.2% |
| Bolivians | 64.0 /100 | #164 | Good 75.2% |
| Afghans | 63.5 /100 | #165 | Good 75.2% |
| Cambodians | 60.5 /100 | #166 | Good 75.2% |
| Immigrants | South Eastern Asia | 57.5 /100 | #167 | Average 75.1% |
| Immigrants | Western Africa | 56.7 /100 | #168 | Average 75.1% |
| Immigrants | Philippines | 55.8 /100 | #169 | Average 75.1% |
| Mexicans | 52.1 /100 | #170 | Average 75.1% |
| Cajuns | 51.1 /100 | #171 | Average 75.1% |
| Yakama | 50.8 /100 | #172 | Average 75.1% |
| Immigrants | Croatia | 50.2 /100 | #173 | Average 75.1% |
Demographics Similar to Immigrants from Uruguay by In Labor Force | Age 20-24
In terms of in labor force | age 20-24, the demographic groups most similar to Immigrants from Uruguay are Arab (74.6%, a difference of 0.0%), Albanian (74.6%, a difference of 0.010%), Uruguayan (74.6%, a difference of 0.020%), Immigrants from Australia (74.6%, a difference of 0.030%), and Sioux (74.6%, a difference of 0.040%).
| Demographics | Rating | Rank | In Labor Force | Age 20-24 |
| Choctaw | 21.4 /100 | #201 | Fair 74.7% |
| Moroccans | 20.4 /100 | #202 | Fair 74.7% |
| Immigrants | Northern Africa | 17.9 /100 | #203 | Poor 74.6% |
| Immigrants | Italy | 17.6 /100 | #204 | Poor 74.6% |
| Inupiat | 17.6 /100 | #205 | Poor 74.6% |
| Sioux | 17.5 /100 | #206 | Poor 74.6% |
| Albanians | 16.2 /100 | #207 | Poor 74.6% |
| Immigrants | Uruguay | 15.8 /100 | #208 | Poor 74.6% |
| Arabs | 15.8 /100 | #209 | Poor 74.6% |
| Uruguayans | 15.1 /100 | #210 | Poor 74.6% |
| Immigrants | Australia | 14.7 /100 | #211 | Poor 74.6% |
| Creek | 13.3 /100 | #212 | Poor 74.5% |
| Peruvians | 13.3 /100 | #213 | Poor 74.5% |
| Immigrants | Southern Europe | 13.2 /100 | #214 | Poor 74.5% |
| Immigrants | Ghana | 12.7 /100 | #215 | Poor 74.5% |