Swiss vs Immigrants from Uruguay Single Father Households
COMPARE
Swiss
Immigrants from Uruguay
Single Father Households
Single Father Households Comparison
Swiss
Immigrants from Uruguay
2.3%
SINGLE FATHER HOUSEHOLDS
73.2/ 100
METRIC RATING
161st/ 347
METRIC RANK
2.4%
SINGLE FATHER HOUSEHOLDS
11.0/ 100
METRIC RATING
223rd/ 347
METRIC RANK
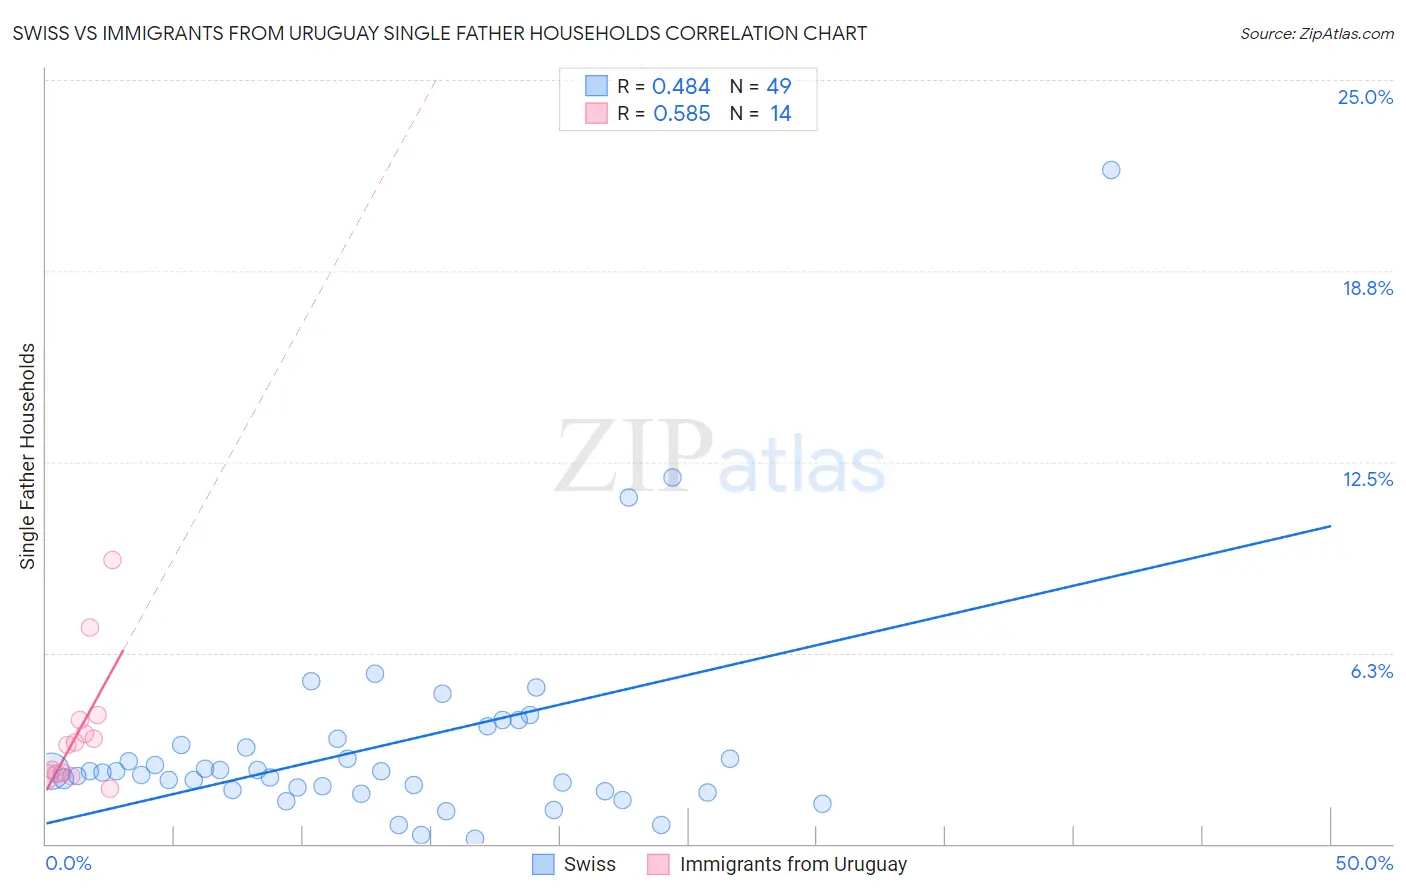
Swiss vs Immigrants from Uruguay Single Father Households Correlation Chart
The statistical analysis conducted on geographies consisting of 458,392,484 people shows a moderate positive correlation between the proportion of Swiss and percentage of single father households in the United States with a correlation coefficient (R) of 0.484 and weighted average of 2.3%. Similarly, the statistical analysis conducted on geographies consisting of 132,991,914 people shows a substantial positive correlation between the proportion of Immigrants from Uruguay and percentage of single father households in the United States with a correlation coefficient (R) of 0.585 and weighted average of 2.4%, a difference of 5.8%.
Single Father Households Correlation Summary
| Measurement | Swiss | Immigrants from Uruguay |
| Minimum | 0.16% | 1.8% |
| Maximum | 22.1% | 9.3% |
| Range | 21.9% | 7.5% |
| Mean | 3.2% | 3.7% |
| Median | 2.4% | 3.3% |
| Interquartile 25% (IQ1) | 1.7% | 2.3% |
| Interquartile 75% (IQ3) | 3.3% | 4.0% |
| Interquartile Range (IQR) | 1.6% | 1.8% |
| Standard Deviation (Sample) | 3.5% | 2.1% |
| Standard Deviation (Population) | 3.5% | 2.0% |
Similar Demographics by Single Father Households
Demographics Similar to Swiss by Single Father Households
In terms of single father households, the demographic groups most similar to Swiss are Scottish (2.3%, a difference of 0.030%), Irish (2.3%, a difference of 0.11%), Pakistani (2.3%, a difference of 0.25%), Immigrants from Bolivia (2.3%, a difference of 0.30%), and Scotch-Irish (2.3%, a difference of 0.35%).
| Demographics | Rating | Rank | Single Father Households |
| Bolivians | 81.0 /100 | #154 | Excellent 2.3% |
| Europeans | 80.9 /100 | #155 | Excellent 2.3% |
| Immigrants | South America | 79.9 /100 | #156 | Good 2.3% |
| Canadians | 79.7 /100 | #157 | Good 2.3% |
| Immigrants | Senegal | 79.4 /100 | #158 | Good 2.3% |
| Immigrants | West Indies | 77.9 /100 | #159 | Good 2.3% |
| Immigrants | Bolivia | 76.3 /100 | #160 | Good 2.3% |
| Swiss | 73.2 /100 | #161 | Good 2.3% |
| Scottish | 72.8 /100 | #162 | Good 2.3% |
| Irish | 72.1 /100 | #163 | Good 2.3% |
| Pakistanis | 70.6 /100 | #164 | Good 2.3% |
| Scotch-Irish | 69.4 /100 | #165 | Good 2.3% |
| English | 68.6 /100 | #166 | Good 2.3% |
| South Americans | 64.3 /100 | #167 | Good 2.3% |
| Icelanders | 63.1 /100 | #168 | Good 2.3% |
Demographics Similar to Immigrants from Uruguay by Single Father Households
In terms of single father households, the demographic groups most similar to Immigrants from Uruguay are Immigrants from Bahamas (2.4%, a difference of 0.070%), Immigrants from Eastern Africa (2.4%, a difference of 0.16%), Immigrants from Burma/Myanmar (2.4%, a difference of 0.19%), Marshallese (2.4%, a difference of 0.25%), and Black/African American (2.4%, a difference of 0.26%).
| Demographics | Rating | Rank | Single Father Households |
| Immigrants | Ecuador | 14.9 /100 | #216 | Poor 2.4% |
| Dutch | 14.3 /100 | #217 | Poor 2.4% |
| Immigrants | Ethiopia | 13.4 /100 | #218 | Poor 2.4% |
| Sudanese | 13.0 /100 | #219 | Poor 2.4% |
| Ghanaians | 12.9 /100 | #220 | Poor 2.4% |
| Immigrants | Burma/Myanmar | 12.1 /100 | #221 | Poor 2.4% |
| Immigrants | Eastern Africa | 11.9 /100 | #222 | Poor 2.4% |
| Immigrants | Uruguay | 11.0 /100 | #223 | Poor 2.4% |
| Immigrants | Bahamas | 10.6 /100 | #224 | Poor 2.4% |
| Marshallese | 9.7 /100 | #225 | Tragic 2.4% |
| Blacks/African Americans | 9.7 /100 | #226 | Tragic 2.4% |
| Americans | 9.3 /100 | #227 | Tragic 2.4% |
| Immigrants | Ghana | 9.1 /100 | #228 | Tragic 2.4% |
| Immigrants | Zaire | 8.6 /100 | #229 | Tragic 2.4% |
| Sub-Saharan Africans | 8.3 /100 | #230 | Tragic 2.4% |