Immigrants from Grenada vs Ecuadorian Single Father Households
COMPARE
Immigrants from Grenada
Ecuadorian
Single Father Households
Single Father Households Comparison
Immigrants from Grenada
Ecuadorians
2.0%
SINGLE FATHER HOUSEHOLDS
100.0/ 100
METRIC RATING
43rd/ 347
METRIC RANK
2.4%
SINGLE FATHER HOUSEHOLDS
24.5/ 100
METRIC RATING
204th/ 347
METRIC RANK
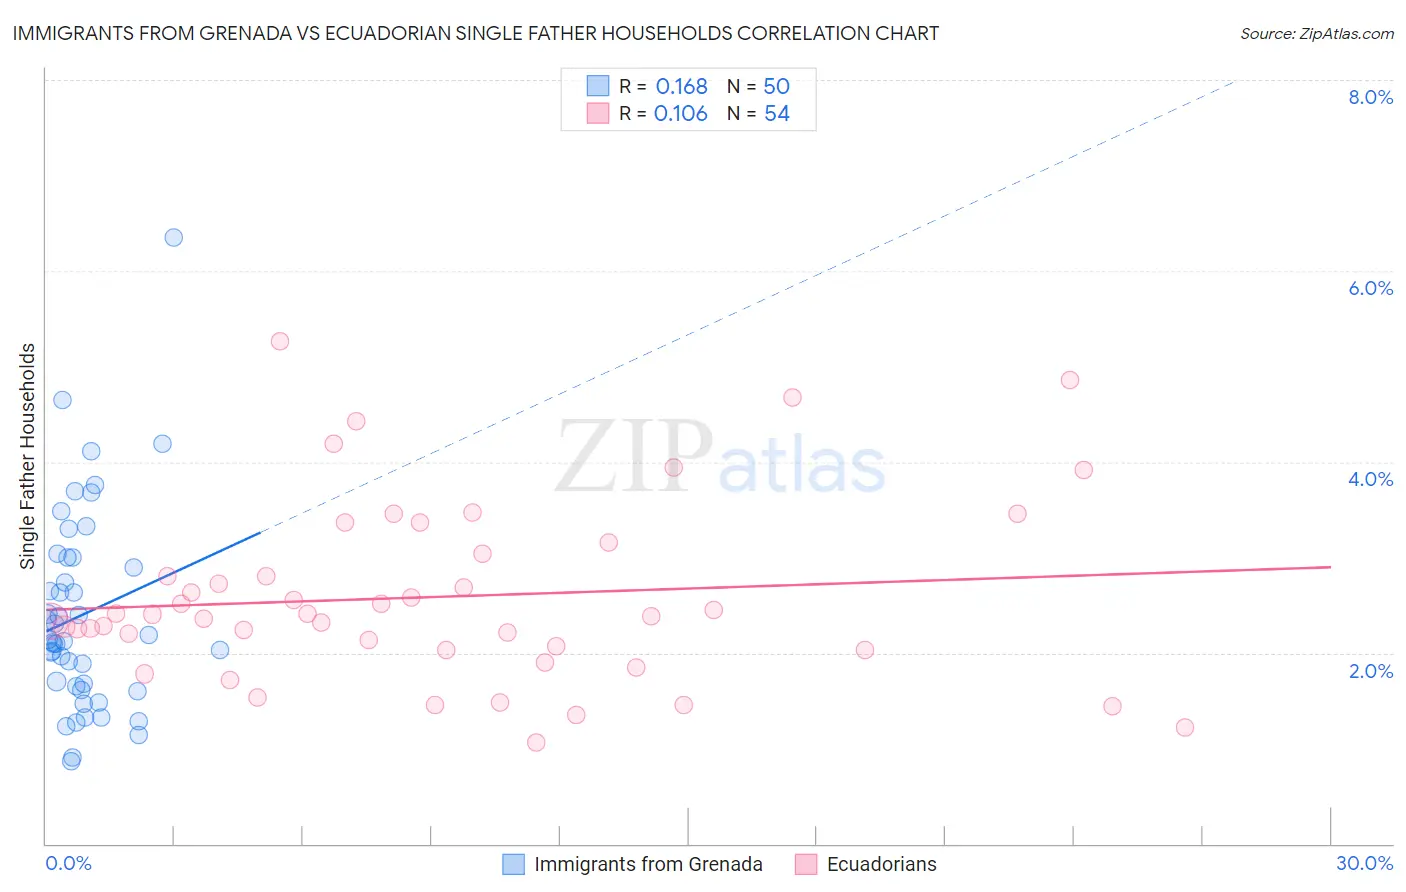
Immigrants from Grenada vs Ecuadorian Single Father Households Correlation Chart
The statistical analysis conducted on geographies consisting of 67,096,407 people shows a poor positive correlation between the proportion of Immigrants from Grenada and percentage of single father households in the United States with a correlation coefficient (R) of 0.168 and weighted average of 2.0%. Similarly, the statistical analysis conducted on geographies consisting of 315,595,316 people shows a poor positive correlation between the proportion of Ecuadorians and percentage of single father households in the United States with a correlation coefficient (R) of 0.106 and weighted average of 2.4%, a difference of 19.1%.
Single Father Households Correlation Summary
| Measurement | Immigrants from Grenada | Ecuadorian |
| Minimum | 0.86% | 1.1% |
| Maximum | 6.4% | 5.3% |
| Range | 5.5% | 4.2% |
| Mean | 2.4% | 2.6% |
| Median | 2.1% | 2.4% |
| Interquartile 25% (IQ1) | 1.6% | 2.0% |
| Interquartile 75% (IQ3) | 3.0% | 3.0% |
| Interquartile Range (IQR) | 1.3% | 1.0% |
| Standard Deviation (Sample) | 1.1% | 0.94% |
| Standard Deviation (Population) | 1.0% | 0.93% |
Similar Demographics by Single Father Households
Demographics Similar to Immigrants from Grenada by Single Father Households
In terms of single father households, the demographic groups most similar to Immigrants from Grenada are Latvian (2.0%, a difference of 0.090%), Russian (2.0%, a difference of 0.10%), Immigrants from Lebanon (2.0%, a difference of 0.21%), Macedonian (2.0%, a difference of 0.23%), and Immigrants from Turkey (2.0%, a difference of 0.38%).
| Demographics | Rating | Rank | Single Father Households |
| Immigrants | Belgium | 100.0 /100 | #36 | Exceptional 2.0% |
| Immigrants | St. Vincent and the Grenadines | 100.0 /100 | #37 | Exceptional 2.0% |
| Immigrants | Eastern Europe | 100.0 /100 | #38 | Exceptional 2.0% |
| Immigrants | Sri Lanka | 100.0 /100 | #39 | Exceptional 2.0% |
| Immigrants | Bulgaria | 100.0 /100 | #40 | Exceptional 2.0% |
| Immigrants | Turkey | 100.0 /100 | #41 | Exceptional 2.0% |
| Macedonians | 100.0 /100 | #42 | Exceptional 2.0% |
| Immigrants | Grenada | 100.0 /100 | #43 | Exceptional 2.0% |
| Latvians | 100.0 /100 | #44 | Exceptional 2.0% |
| Russians | 100.0 /100 | #45 | Exceptional 2.0% |
| Immigrants | Lebanon | 100.0 /100 | #46 | Exceptional 2.0% |
| Immigrants | Ukraine | 99.9 /100 | #47 | Exceptional 2.0% |
| Immigrants | Kazakhstan | 99.9 /100 | #48 | Exceptional 2.0% |
| Immigrants | Serbia | 99.9 /100 | #49 | Exceptional 2.0% |
| Immigrants | Switzerland | 99.9 /100 | #50 | Exceptional 2.0% |
Demographics Similar to Ecuadorians by Single Father Households
In terms of single father households, the demographic groups most similar to Ecuadorians are French Canadian (2.4%, a difference of 0.020%), Immigrants from Afghanistan (2.4%, a difference of 0.030%), Korean (2.4%, a difference of 0.030%), German Russian (2.4%, a difference of 0.12%), and Immigrants from Uganda (2.4%, a difference of 0.15%).
| Demographics | Rating | Rank | Single Father Households |
| Germans | 28.0 /100 | #197 | Fair 2.4% |
| Scandinavians | 27.4 /100 | #198 | Fair 2.4% |
| Immigrants | Vietnam | 27.1 /100 | #199 | Fair 2.4% |
| Peruvians | 27.1 /100 | #200 | Fair 2.4% |
| Immigrants | Uganda | 26.0 /100 | #201 | Fair 2.4% |
| German Russians | 25.7 /100 | #202 | Fair 2.4% |
| French Canadians | 24.7 /100 | #203 | Fair 2.4% |
| Ecuadorians | 24.5 /100 | #204 | Fair 2.4% |
| Immigrants | Afghanistan | 24.2 /100 | #205 | Fair 2.4% |
| Koreans | 24.1 /100 | #206 | Fair 2.4% |
| Whites/Caucasians | 22.6 /100 | #207 | Fair 2.4% |
| Immigrants | Kenya | 20.3 /100 | #208 | Fair 2.4% |
| Immigrants | Peru | 19.3 /100 | #209 | Poor 2.4% |
| Immigrants | Costa Rica | 19.2 /100 | #210 | Poor 2.4% |
| Immigrants | Nigeria | 18.7 /100 | #211 | Poor 2.4% |