Bulgarian vs Subsaharan African Single Father Households
COMPARE
Bulgarian
Subsaharan African
Single Father Households
Single Father Households Comparison
Bulgarians
Sub-Saharan Africans
2.0%
SINGLE FATHER HOUSEHOLDS
100.0/ 100
METRIC RATING
29th/ 347
METRIC RANK
2.4%
SINGLE FATHER HOUSEHOLDS
8.3/ 100
METRIC RATING
230th/ 347
METRIC RANK
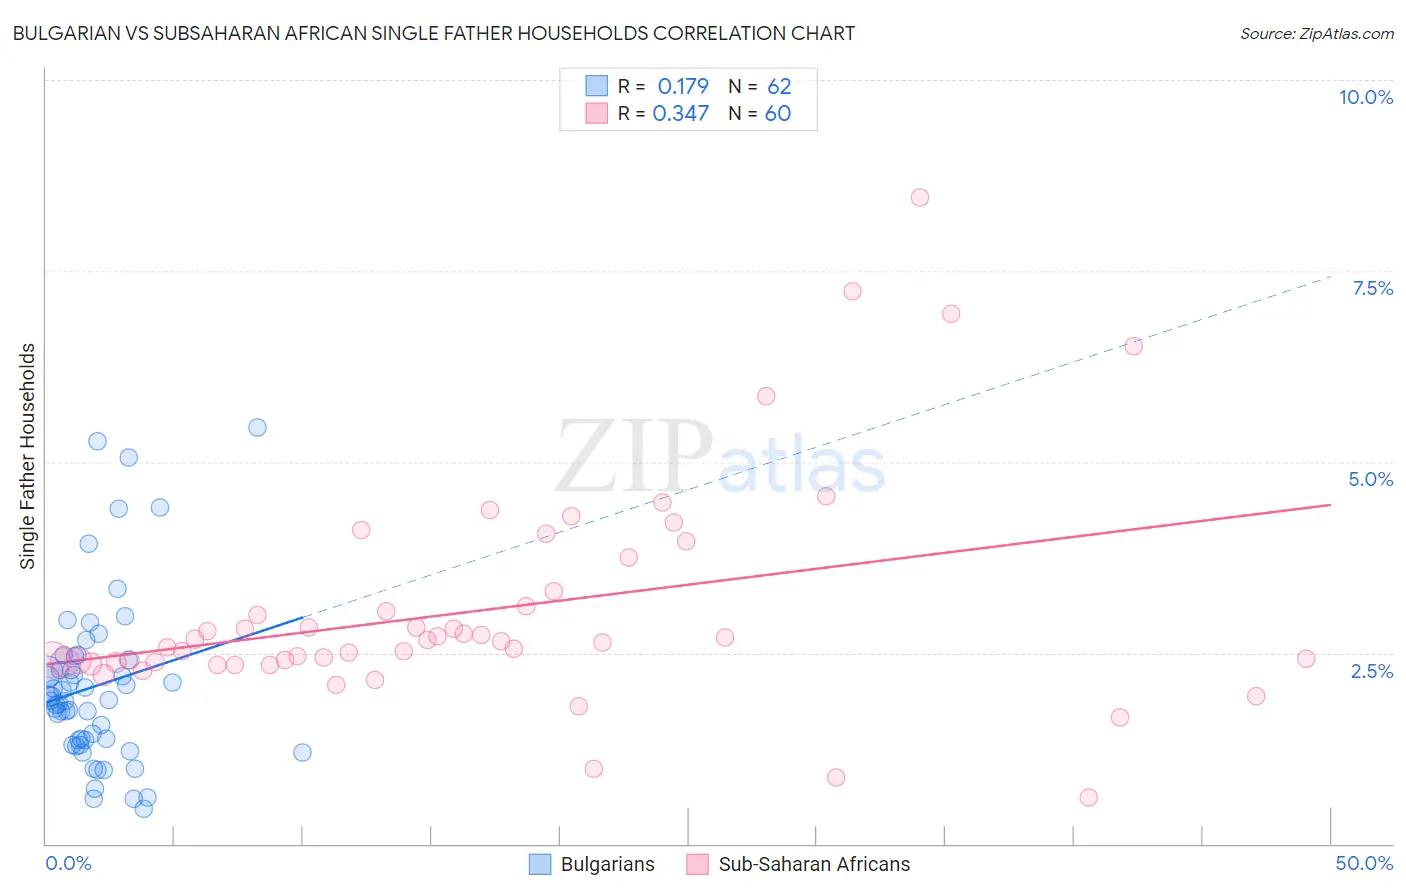
Bulgarian vs Subsaharan African Single Father Households Correlation Chart
The statistical analysis conducted on geographies consisting of 204,652,646 people shows a poor positive correlation between the proportion of Bulgarians and percentage of single father households in the United States with a correlation coefficient (R) of 0.179 and weighted average of 2.0%. Similarly, the statistical analysis conducted on geographies consisting of 500,994,896 people shows a mild positive correlation between the proportion of Sub-Saharan Africans and percentage of single father households in the United States with a correlation coefficient (R) of 0.347 and weighted average of 2.4%, a difference of 23.9%.
Single Father Households Correlation Summary
| Measurement | Bulgarian | Subsaharan African |
| Minimum | 0.45% | 0.60% |
| Maximum | 5.5% | 8.5% |
| Range | 5.0% | 7.9% |
| Mean | 2.1% | 3.1% |
| Median | 1.9% | 2.6% |
| Interquartile 25% (IQ1) | 1.4% | 2.4% |
| Interquartile 75% (IQ3) | 2.4% | 3.2% |
| Interquartile Range (IQR) | 1.1% | 0.83% |
| Standard Deviation (Sample) | 1.1% | 1.5% |
| Standard Deviation (Population) | 1.1% | 1.4% |
Similar Demographics by Single Father Households
Demographics Similar to Bulgarians by Single Father Households
In terms of single father households, the demographic groups most similar to Bulgarians are Cambodian (2.0%, a difference of 0.020%), Israeli (2.0%, a difference of 0.050%), Immigrants from Japan (2.0%, a difference of 0.090%), Chinese (2.0%, a difference of 0.090%), and Immigrants from South Central Asia (2.0%, a difference of 0.27%).
| Demographics | Rating | Rank | Single Father Households |
| Immigrants | Latvia | 100.0 /100 | #22 | Exceptional 1.9% |
| Immigrants | Croatia | 100.0 /100 | #23 | Exceptional 2.0% |
| Immigrants | Russia | 100.0 /100 | #24 | Exceptional 2.0% |
| Eastern Europeans | 100.0 /100 | #25 | Exceptional 2.0% |
| Assyrians/Chaldeans/Syriacs | 100.0 /100 | #26 | Exceptional 2.0% |
| Immigrants | South Central Asia | 100.0 /100 | #27 | Exceptional 2.0% |
| Immigrants | Japan | 100.0 /100 | #28 | Exceptional 2.0% |
| Bulgarians | 100.0 /100 | #29 | Exceptional 2.0% |
| Cambodians | 100.0 /100 | #30 | Exceptional 2.0% |
| Israelis | 100.0 /100 | #31 | Exceptional 2.0% |
| Chinese | 100.0 /100 | #32 | Exceptional 2.0% |
| Turks | 100.0 /100 | #33 | Exceptional 2.0% |
| Immigrants | Australia | 100.0 /100 | #34 | Exceptional 2.0% |
| Albanians | 100.0 /100 | #35 | Exceptional 2.0% |
| Immigrants | Belgium | 100.0 /100 | #36 | Exceptional 2.0% |
Demographics Similar to Sub-Saharan Africans by Single Father Households
In terms of single father households, the demographic groups most similar to Sub-Saharan Africans are Immigrants from Zaire (2.4%, a difference of 0.090%), Nonimmigrants (2.4%, a difference of 0.16%), Immigrants from Ghana (2.4%, a difference of 0.20%), American (2.4%, a difference of 0.24%), and Pennsylvania German (2.4%, a difference of 0.25%).
| Demographics | Rating | Rank | Single Father Households |
| Immigrants | Uruguay | 11.0 /100 | #223 | Poor 2.4% |
| Immigrants | Bahamas | 10.6 /100 | #224 | Poor 2.4% |
| Marshallese | 9.7 /100 | #225 | Tragic 2.4% |
| Blacks/African Americans | 9.7 /100 | #226 | Tragic 2.4% |
| Americans | 9.3 /100 | #227 | Tragic 2.4% |
| Immigrants | Ghana | 9.1 /100 | #228 | Tragic 2.4% |
| Immigrants | Zaire | 8.6 /100 | #229 | Tragic 2.4% |
| Sub-Saharan Africans | 8.3 /100 | #230 | Tragic 2.4% |
| Immigrants | Nonimmigrants | 7.6 /100 | #231 | Tragic 2.4% |
| Pennsylvania Germans | 7.3 /100 | #232 | Tragic 2.4% |
| Immigrants | Western Africa | 7.0 /100 | #233 | Tragic 2.4% |
| Africans | 6.3 /100 | #234 | Tragic 2.5% |
| Immigrants | Immigrants | 6.3 /100 | #235 | Tragic 2.5% |
| Cajuns | 6.1 /100 | #236 | Tragic 2.5% |
| Sierra Leoneans | 5.9 /100 | #237 | Tragic 2.5% |