Bulgarian vs Immigrants from Colombia Single Father Households
COMPARE
Bulgarian
Immigrants from Colombia
Single Father Households
Single Father Households Comparison
Bulgarians
Immigrants from Colombia
2.0%
SINGLE FATHER HOUSEHOLDS
100.0/ 100
METRIC RATING
29th/ 347
METRIC RANK
2.4%
SINGLE FATHER HOUSEHOLDS
34.0/ 100
METRIC RATING
187th/ 347
METRIC RANK
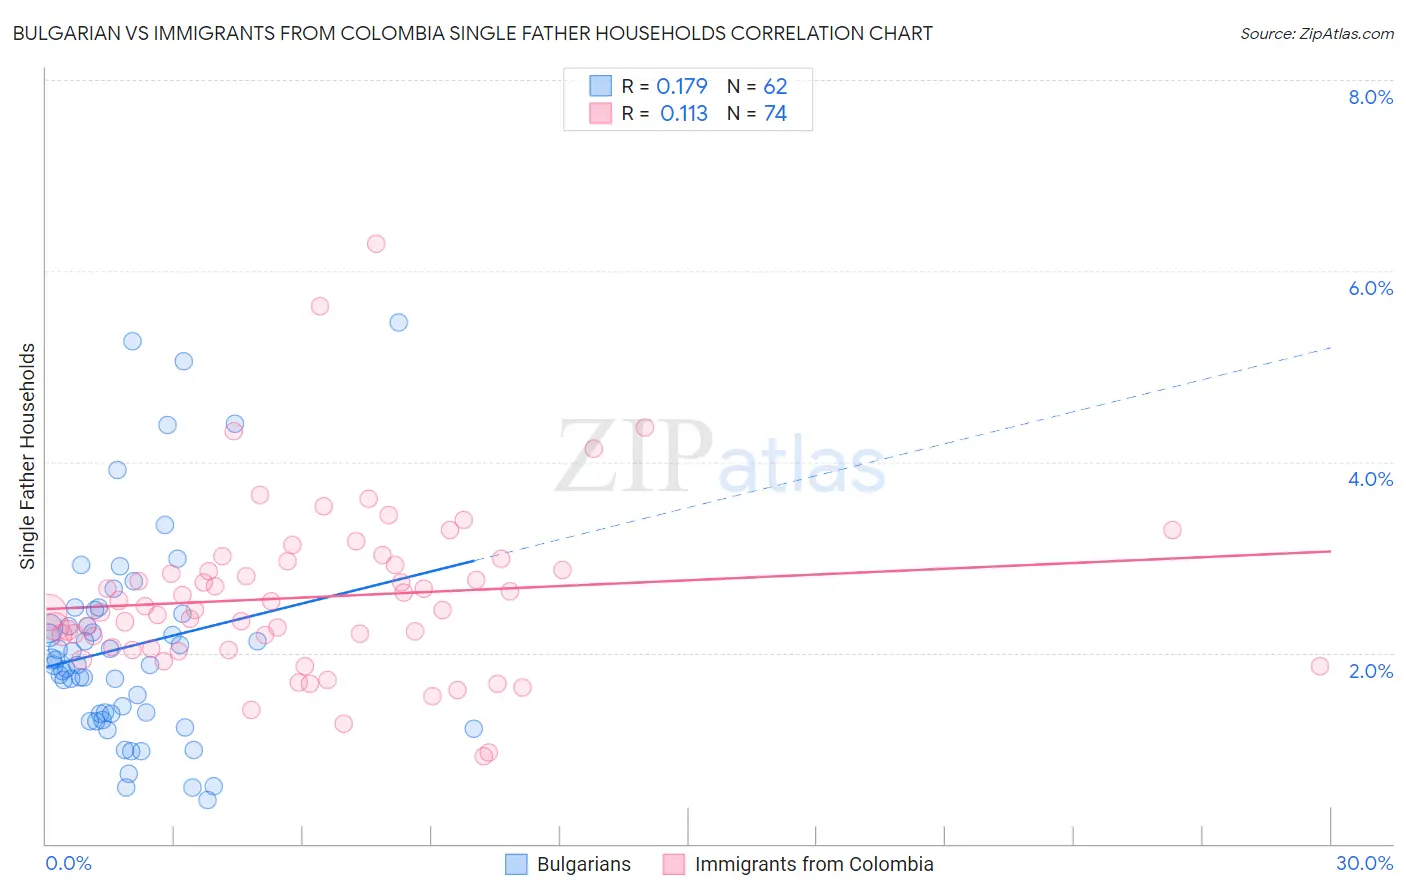
Bulgarian vs Immigrants from Colombia Single Father Households Correlation Chart
The statistical analysis conducted on geographies consisting of 204,652,646 people shows a poor positive correlation between the proportion of Bulgarians and percentage of single father households in the United States with a correlation coefficient (R) of 0.179 and weighted average of 2.0%. Similarly, the statistical analysis conducted on geographies consisting of 375,877,242 people shows a poor positive correlation between the proportion of Immigrants from Colombia and percentage of single father households in the United States with a correlation coefficient (R) of 0.113 and weighted average of 2.4%, a difference of 20.1%.
Single Father Households Correlation Summary
| Measurement | Bulgarian | Immigrants from Colombia |
| Minimum | 0.45% | 0.91% |
| Maximum | 5.5% | 6.3% |
| Range | 5.0% | 5.4% |
| Mean | 2.1% | 2.6% |
| Median | 1.9% | 2.4% |
| Interquartile 25% (IQ1) | 1.4% | 2.0% |
| Interquartile 75% (IQ3) | 2.4% | 2.9% |
| Interquartile Range (IQR) | 1.1% | 0.88% |
| Standard Deviation (Sample) | 1.1% | 0.90% |
| Standard Deviation (Population) | 1.1% | 0.89% |
Similar Demographics by Single Father Households
Demographics Similar to Bulgarians by Single Father Households
In terms of single father households, the demographic groups most similar to Bulgarians are Cambodian (2.0%, a difference of 0.020%), Israeli (2.0%, a difference of 0.050%), Immigrants from Japan (2.0%, a difference of 0.090%), Chinese (2.0%, a difference of 0.090%), and Immigrants from South Central Asia (2.0%, a difference of 0.27%).
| Demographics | Rating | Rank | Single Father Households |
| Immigrants | Latvia | 100.0 /100 | #22 | Exceptional 1.9% |
| Immigrants | Croatia | 100.0 /100 | #23 | Exceptional 2.0% |
| Immigrants | Russia | 100.0 /100 | #24 | Exceptional 2.0% |
| Eastern Europeans | 100.0 /100 | #25 | Exceptional 2.0% |
| Assyrians/Chaldeans/Syriacs | 100.0 /100 | #26 | Exceptional 2.0% |
| Immigrants | South Central Asia | 100.0 /100 | #27 | Exceptional 2.0% |
| Immigrants | Japan | 100.0 /100 | #28 | Exceptional 2.0% |
| Bulgarians | 100.0 /100 | #29 | Exceptional 2.0% |
| Cambodians | 100.0 /100 | #30 | Exceptional 2.0% |
| Israelis | 100.0 /100 | #31 | Exceptional 2.0% |
| Chinese | 100.0 /100 | #32 | Exceptional 2.0% |
| Turks | 100.0 /100 | #33 | Exceptional 2.0% |
| Immigrants | Australia | 100.0 /100 | #34 | Exceptional 2.0% |
| Albanians | 100.0 /100 | #35 | Exceptional 2.0% |
| Immigrants | Belgium | 100.0 /100 | #36 | Exceptional 2.0% |
Demographics Similar to Immigrants from Colombia by Single Father Households
In terms of single father households, the demographic groups most similar to Immigrants from Colombia are Hmong (2.4%, a difference of 0.080%), U.S. Virgin Islander (2.4%, a difference of 0.18%), French (2.4%, a difference of 0.19%), Immigrants from Africa (2.4%, a difference of 0.33%), and Immigrants from Sudan (2.4%, a difference of 0.35%).
| Demographics | Rating | Rank | Single Father Households |
| Yugoslavians | 43.9 /100 | #180 | Average 2.3% |
| Jamaicans | 43.5 /100 | #181 | Average 2.3% |
| Belgians | 43.3 /100 | #182 | Average 2.3% |
| Immigrants | Panama | 41.8 /100 | #183 | Average 2.4% |
| Sri Lankans | 41.8 /100 | #184 | Average 2.4% |
| Nigerians | 41.0 /100 | #185 | Average 2.4% |
| Immigrants | Bosnia and Herzegovina | 40.4 /100 | #186 | Average 2.4% |
| Immigrants | Colombia | 34.0 /100 | #187 | Fair 2.4% |
| Hmong | 33.0 /100 | #188 | Fair 2.4% |
| U.S. Virgin Islanders | 31.8 /100 | #189 | Fair 2.4% |
| French | 31.7 /100 | #190 | Fair 2.4% |
| Immigrants | Africa | 30.0 /100 | #191 | Fair 2.4% |
| Immigrants | Sudan | 29.8 /100 | #192 | Fair 2.4% |
| Uruguayans | 29.7 /100 | #193 | Fair 2.4% |
| Panamanians | 29.6 /100 | #194 | Fair 2.4% |