African vs Ecuadorian Single Father Households
COMPARE
African
Ecuadorian
Single Father Households
Single Father Households Comparison
Africans
Ecuadorians
2.5%
SINGLE FATHER HOUSEHOLDS
6.3/ 100
METRIC RATING
234th/ 347
METRIC RANK
2.4%
SINGLE FATHER HOUSEHOLDS
24.5/ 100
METRIC RATING
204th/ 347
METRIC RANK
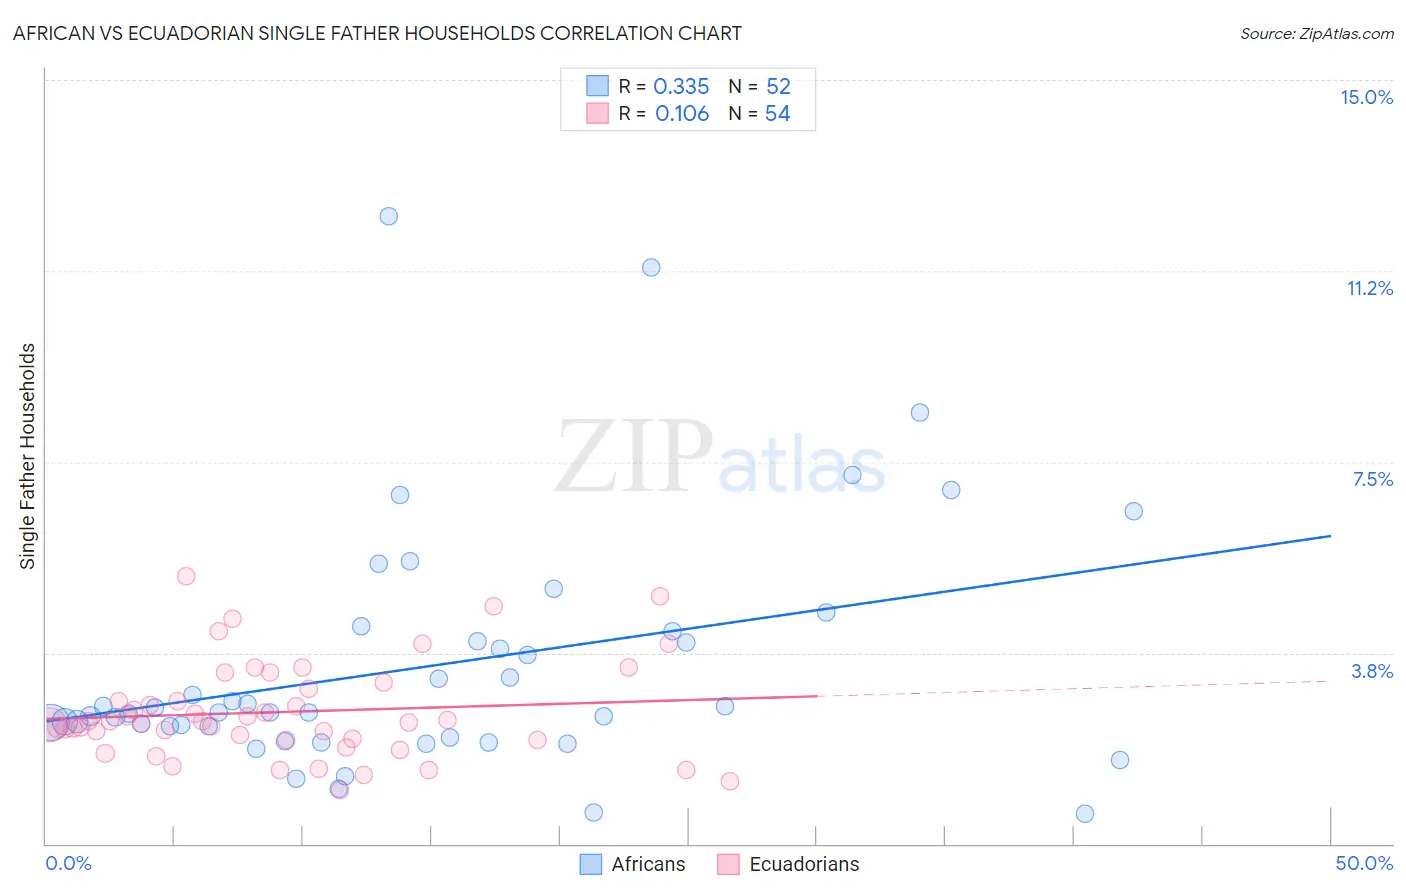
African vs Ecuadorian Single Father Households Correlation Chart
The statistical analysis conducted on geographies consisting of 464,994,675 people shows a mild positive correlation between the proportion of Africans and percentage of single father households in the United States with a correlation coefficient (R) of 0.335 and weighted average of 2.5%. Similarly, the statistical analysis conducted on geographies consisting of 315,595,316 people shows a poor positive correlation between the proportion of Ecuadorians and percentage of single father households in the United States with a correlation coefficient (R) of 0.106 and weighted average of 2.4%, a difference of 2.8%.
Single Father Households Correlation Summary
| Measurement | African | Ecuadorian |
| Minimum | 0.60% | 1.1% |
| Maximum | 12.3% | 5.3% |
| Range | 11.7% | 4.2% |
| Mean | 3.5% | 2.6% |
| Median | 2.6% | 2.4% |
| Interquartile 25% (IQ1) | 2.2% | 2.0% |
| Interquartile 75% (IQ3) | 4.1% | 3.0% |
| Interquartile Range (IQR) | 1.9% | 1.0% |
| Standard Deviation (Sample) | 2.4% | 0.94% |
| Standard Deviation (Population) | 2.4% | 0.93% |
Similar Demographics by Single Father Households
Demographics Similar to Africans by Single Father Households
In terms of single father households, the demographic groups most similar to Africans are Immigrants (2.5%, a difference of 0.020%), Cajun (2.5%, a difference of 0.070%), Sierra Leonean (2.5%, a difference of 0.12%), Immigrants from Sierra Leone (2.5%, a difference of 0.15%), and Immigrants from Oceania (2.5%, a difference of 0.16%).
| Demographics | Rating | Rank | Single Father Households |
| Americans | 9.3 /100 | #227 | Tragic 2.4% |
| Immigrants | Ghana | 9.1 /100 | #228 | Tragic 2.4% |
| Immigrants | Zaire | 8.6 /100 | #229 | Tragic 2.4% |
| Sub-Saharan Africans | 8.3 /100 | #230 | Tragic 2.4% |
| Immigrants | Nonimmigrants | 7.6 /100 | #231 | Tragic 2.4% |
| Pennsylvania Germans | 7.3 /100 | #232 | Tragic 2.4% |
| Immigrants | Western Africa | 7.0 /100 | #233 | Tragic 2.4% |
| Africans | 6.3 /100 | #234 | Tragic 2.5% |
| Immigrants | Immigrants | 6.3 /100 | #235 | Tragic 2.5% |
| Cajuns | 6.1 /100 | #236 | Tragic 2.5% |
| Sierra Leoneans | 5.9 /100 | #237 | Tragic 2.5% |
| Immigrants | Sierra Leone | 5.8 /100 | #238 | Tragic 2.5% |
| Immigrants | Oceania | 5.8 /100 | #239 | Tragic 2.5% |
| Immigrants | Dominica | 4.8 /100 | #240 | Tragic 2.5% |
| Portuguese | 4.1 /100 | #241 | Tragic 2.5% |
Demographics Similar to Ecuadorians by Single Father Households
In terms of single father households, the demographic groups most similar to Ecuadorians are French Canadian (2.4%, a difference of 0.020%), Immigrants from Afghanistan (2.4%, a difference of 0.030%), Korean (2.4%, a difference of 0.030%), German Russian (2.4%, a difference of 0.12%), and Immigrants from Uganda (2.4%, a difference of 0.15%).
| Demographics | Rating | Rank | Single Father Households |
| Germans | 28.0 /100 | #197 | Fair 2.4% |
| Scandinavians | 27.4 /100 | #198 | Fair 2.4% |
| Immigrants | Vietnam | 27.1 /100 | #199 | Fair 2.4% |
| Peruvians | 27.1 /100 | #200 | Fair 2.4% |
| Immigrants | Uganda | 26.0 /100 | #201 | Fair 2.4% |
| German Russians | 25.7 /100 | #202 | Fair 2.4% |
| French Canadians | 24.7 /100 | #203 | Fair 2.4% |
| Ecuadorians | 24.5 /100 | #204 | Fair 2.4% |
| Immigrants | Afghanistan | 24.2 /100 | #205 | Fair 2.4% |
| Koreans | 24.1 /100 | #206 | Fair 2.4% |
| Whites/Caucasians | 22.6 /100 | #207 | Fair 2.4% |
| Immigrants | Kenya | 20.3 /100 | #208 | Fair 2.4% |
| Immigrants | Peru | 19.3 /100 | #209 | Poor 2.4% |
| Immigrants | Costa Rica | 19.2 /100 | #210 | Poor 2.4% |
| Immigrants | Nigeria | 18.7 /100 | #211 | Poor 2.4% |