Cherokee vs Immigrants from Netherlands Single Father Households
COMPARE
Cherokee
Immigrants from Netherlands
Single Father Households
Single Father Households Comparison
Cherokee
Immigrants from Netherlands
2.6%
SINGLE FATHER HOUSEHOLDS
0.1/ 100
METRIC RATING
278th/ 347
METRIC RANK
2.2%
SINGLE FATHER HOUSEHOLDS
98.5/ 100
METRIC RATING
108th/ 347
METRIC RANK
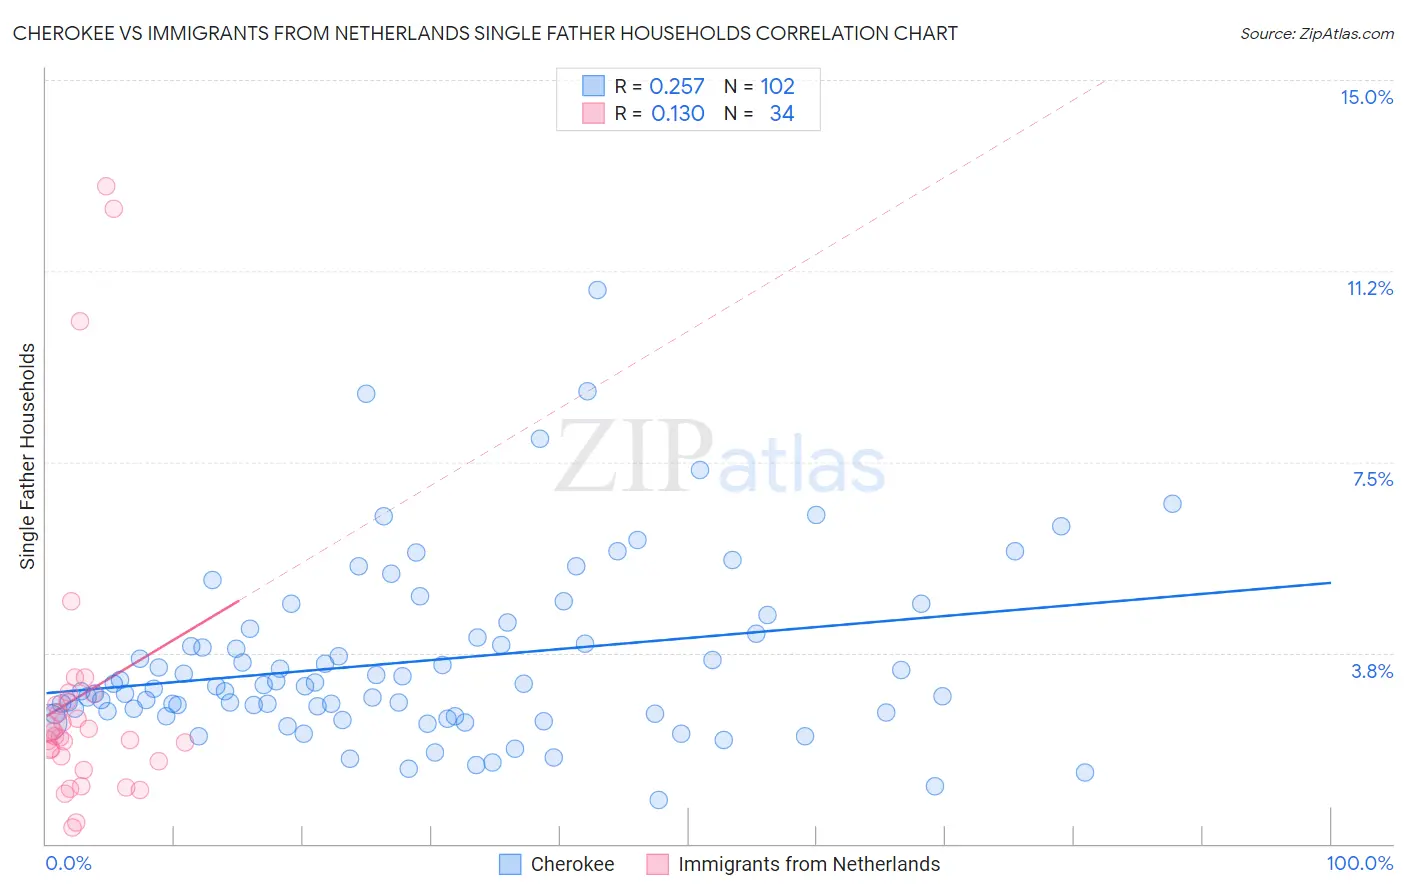
Cherokee vs Immigrants from Netherlands Single Father Households Correlation Chart
The statistical analysis conducted on geographies consisting of 486,508,076 people shows a weak positive correlation between the proportion of Cherokee and percentage of single father households in the United States with a correlation coefficient (R) of 0.257 and weighted average of 2.6%. Similarly, the statistical analysis conducted on geographies consisting of 236,298,420 people shows a poor positive correlation between the proportion of Immigrants from Netherlands and percentage of single father households in the United States with a correlation coefficient (R) of 0.130 and weighted average of 2.2%, a difference of 21.5%.
Single Father Households Correlation Summary
| Measurement | Cherokee | Immigrants from Netherlands |
| Minimum | 0.86% | 0.33% |
| Maximum | 10.9% | 12.9% |
| Range | 10.0% | 12.6% |
| Mean | 3.6% | 2.9% |
| Median | 3.1% | 2.1% |
| Interquartile 25% (IQ1) | 2.6% | 1.6% |
| Interquartile 75% (IQ3) | 4.1% | 2.8% |
| Interquartile Range (IQR) | 1.6% | 1.2% |
| Standard Deviation (Sample) | 1.7% | 3.0% |
| Standard Deviation (Population) | 1.7% | 2.9% |
Similar Demographics by Single Father Households
Demographics Similar to Cherokee by Single Father Households
In terms of single father households, the demographic groups most similar to Cherokee are Samoan (2.6%, a difference of 0.040%), Shoshone (2.6%, a difference of 0.050%), Immigrants from Haiti (2.6%, a difference of 0.080%), Immigrants from Dominican Republic (2.6%, a difference of 0.29%), and Immigrants from Portugal (2.6%, a difference of 0.59%).
| Demographics | Rating | Rank | Single Father Households |
| Creek | 0.2 /100 | #271 | Tragic 2.6% |
| Belizeans | 0.2 /100 | #272 | Tragic 2.6% |
| Iroquois | 0.2 /100 | #273 | Tragic 2.6% |
| Puerto Ricans | 0.2 /100 | #274 | Tragic 2.6% |
| Immigrants | Dominican Republic | 0.2 /100 | #275 | Tragic 2.6% |
| Immigrants | Haiti | 0.1 /100 | #276 | Tragic 2.6% |
| Shoshone | 0.1 /100 | #277 | Tragic 2.6% |
| Cherokee | 0.1 /100 | #278 | Tragic 2.6% |
| Samoans | 0.1 /100 | #279 | Tragic 2.6% |
| Immigrants | Portugal | 0.1 /100 | #280 | Tragic 2.6% |
| Nicaraguans | 0.1 /100 | #281 | Tragic 2.6% |
| Dutch West Indians | 0.1 /100 | #282 | Tragic 2.6% |
| Immigrants | Nicaragua | 0.1 /100 | #283 | Tragic 2.7% |
| Hawaiians | 0.1 /100 | #284 | Tragic 2.7% |
| Ottawa | 0.1 /100 | #285 | Tragic 2.7% |
Demographics Similar to Immigrants from Netherlands by Single Father Households
In terms of single father households, the demographic groups most similar to Immigrants from Netherlands are Slovene (2.2%, a difference of 0.020%), Barbadian (2.2%, a difference of 0.040%), Immigrants from Southern Europe (2.2%, a difference of 0.14%), Italian (2.2%, a difference of 0.16%), and Immigrants from Canada (2.2%, a difference of 0.24%).
| Demographics | Rating | Rank | Single Father Households |
| Immigrants | Western Europe | 98.9 /100 | #101 | Exceptional 2.1% |
| Argentineans | 98.9 /100 | #102 | Exceptional 2.1% |
| Lebanese | 98.9 /100 | #103 | Exceptional 2.1% |
| Alsatians | 98.9 /100 | #104 | Exceptional 2.1% |
| Palestinians | 98.6 /100 | #105 | Exceptional 2.2% |
| Immigrants | Southern Europe | 98.6 /100 | #106 | Exceptional 2.2% |
| Slovenes | 98.5 /100 | #107 | Exceptional 2.2% |
| Immigrants | Netherlands | 98.5 /100 | #108 | Exceptional 2.2% |
| Barbadians | 98.4 /100 | #109 | Exceptional 2.2% |
| Italians | 98.3 /100 | #110 | Exceptional 2.2% |
| Immigrants | Canada | 98.3 /100 | #111 | Exceptional 2.2% |
| Immigrants | Trinidad and Tobago | 98.2 /100 | #112 | Exceptional 2.2% |
| Iraqis | 98.2 /100 | #113 | Exceptional 2.2% |
| Immigrants | North America | 98.2 /100 | #114 | Exceptional 2.2% |
| Immigrants | Barbados | 98.2 /100 | #115 | Exceptional 2.2% |