Ghanaian vs Immigrants from Netherlands Single Father Households
COMPARE
Ghanaian
Immigrants from Netherlands
Single Father Households
Single Father Households Comparison
Ghanaians
Immigrants from Netherlands
2.4%
SINGLE FATHER HOUSEHOLDS
12.9/ 100
METRIC RATING
220th/ 347
METRIC RANK
2.2%
SINGLE FATHER HOUSEHOLDS
98.5/ 100
METRIC RATING
108th/ 347
METRIC RANK
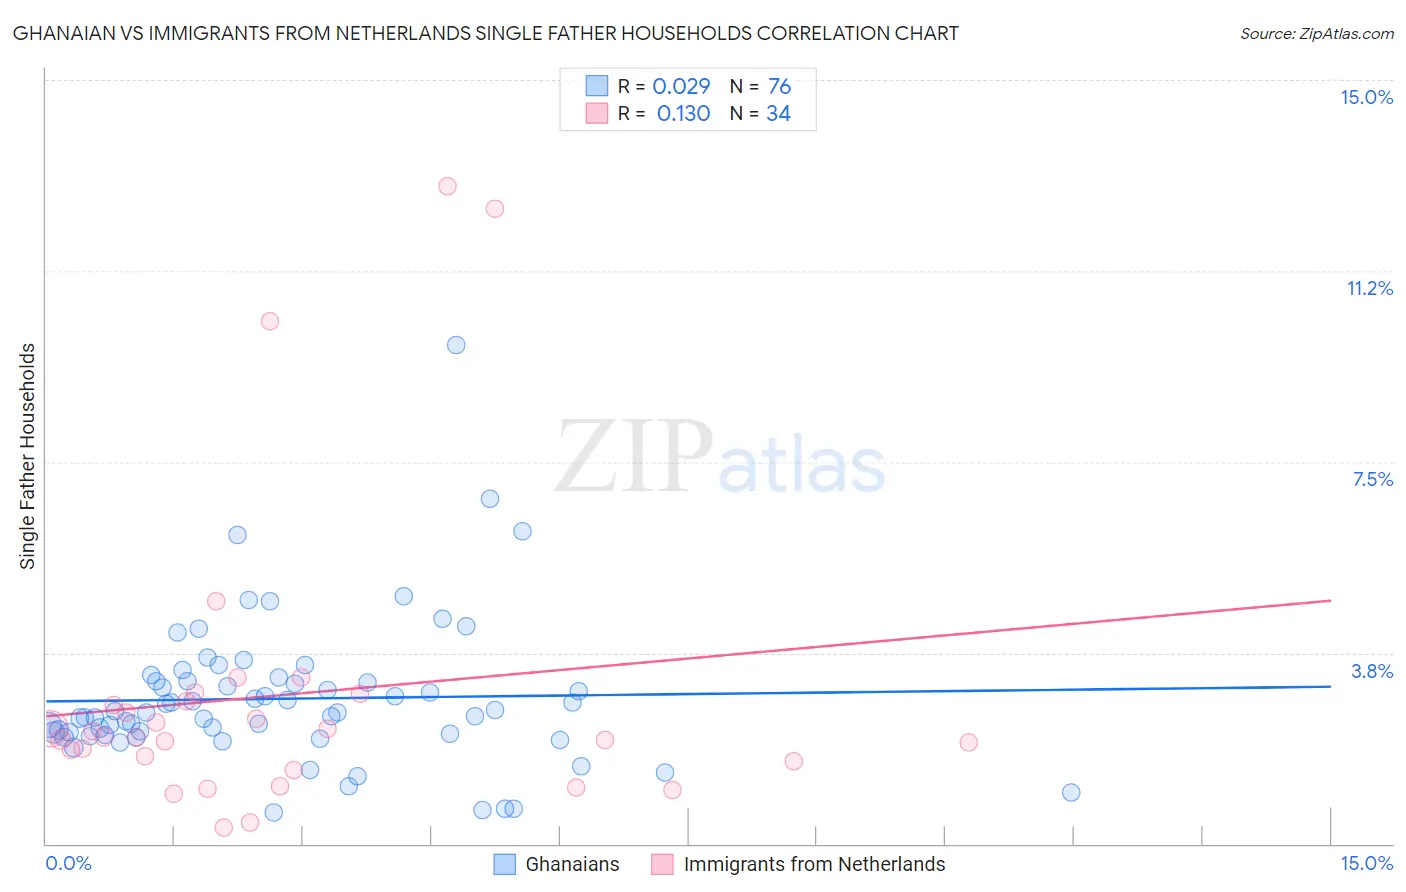
Ghanaian vs Immigrants from Netherlands Single Father Households Correlation Chart
The statistical analysis conducted on geographies consisting of 189,857,222 people shows no correlation between the proportion of Ghanaians and percentage of single father households in the United States with a correlation coefficient (R) of 0.029 and weighted average of 2.4%. Similarly, the statistical analysis conducted on geographies consisting of 236,298,420 people shows a poor positive correlation between the proportion of Immigrants from Netherlands and percentage of single father households in the United States with a correlation coefficient (R) of 0.130 and weighted average of 2.2%, a difference of 12.1%.
Single Father Households Correlation Summary
| Measurement | Ghanaian | Immigrants from Netherlands |
| Minimum | 0.61% | 0.33% |
| Maximum | 9.8% | 12.9% |
| Range | 9.2% | 12.6% |
| Mean | 2.8% | 2.9% |
| Median | 2.6% | 2.1% |
| Interquartile 25% (IQ1) | 2.1% | 1.6% |
| Interquartile 75% (IQ3) | 3.2% | 2.8% |
| Interquartile Range (IQR) | 1.0% | 1.2% |
| Standard Deviation (Sample) | 1.4% | 3.0% |
| Standard Deviation (Population) | 1.4% | 2.9% |
Similar Demographics by Single Father Households
Demographics Similar to Ghanaians by Single Father Households
In terms of single father households, the demographic groups most similar to Ghanaians are Sudanese (2.4%, a difference of 0.010%), Immigrants from Ethiopia (2.4%, a difference of 0.080%), Immigrants from Burma/Myanmar (2.4%, a difference of 0.13%), Immigrants from Eastern Africa (2.4%, a difference of 0.16%), and Dutch (2.4%, a difference of 0.21%).
| Demographics | Rating | Rank | Single Father Households |
| Norwegians | 17.1 /100 | #213 | Poor 2.4% |
| Ethiopians | 16.6 /100 | #214 | Poor 2.4% |
| Immigrants | South Eastern Asia | 15.9 /100 | #215 | Poor 2.4% |
| Immigrants | Ecuador | 14.9 /100 | #216 | Poor 2.4% |
| Dutch | 14.3 /100 | #217 | Poor 2.4% |
| Immigrants | Ethiopia | 13.4 /100 | #218 | Poor 2.4% |
| Sudanese | 13.0 /100 | #219 | Poor 2.4% |
| Ghanaians | 12.9 /100 | #220 | Poor 2.4% |
| Immigrants | Burma/Myanmar | 12.1 /100 | #221 | Poor 2.4% |
| Immigrants | Eastern Africa | 11.9 /100 | #222 | Poor 2.4% |
| Immigrants | Uruguay | 11.0 /100 | #223 | Poor 2.4% |
| Immigrants | Bahamas | 10.6 /100 | #224 | Poor 2.4% |
| Marshallese | 9.7 /100 | #225 | Tragic 2.4% |
| Blacks/African Americans | 9.7 /100 | #226 | Tragic 2.4% |
| Americans | 9.3 /100 | #227 | Tragic 2.4% |
Demographics Similar to Immigrants from Netherlands by Single Father Households
In terms of single father households, the demographic groups most similar to Immigrants from Netherlands are Slovene (2.2%, a difference of 0.020%), Barbadian (2.2%, a difference of 0.040%), Immigrants from Southern Europe (2.2%, a difference of 0.14%), Italian (2.2%, a difference of 0.16%), and Immigrants from Canada (2.2%, a difference of 0.24%).
| Demographics | Rating | Rank | Single Father Households |
| Immigrants | Western Europe | 98.9 /100 | #101 | Exceptional 2.1% |
| Argentineans | 98.9 /100 | #102 | Exceptional 2.1% |
| Lebanese | 98.9 /100 | #103 | Exceptional 2.1% |
| Alsatians | 98.9 /100 | #104 | Exceptional 2.1% |
| Palestinians | 98.6 /100 | #105 | Exceptional 2.2% |
| Immigrants | Southern Europe | 98.6 /100 | #106 | Exceptional 2.2% |
| Slovenes | 98.5 /100 | #107 | Exceptional 2.2% |
| Immigrants | Netherlands | 98.5 /100 | #108 | Exceptional 2.2% |
| Barbadians | 98.4 /100 | #109 | Exceptional 2.2% |
| Italians | 98.3 /100 | #110 | Exceptional 2.2% |
| Immigrants | Canada | 98.3 /100 | #111 | Exceptional 2.2% |
| Immigrants | Trinidad and Tobago | 98.2 /100 | #112 | Exceptional 2.2% |
| Iraqis | 98.2 /100 | #113 | Exceptional 2.2% |
| Immigrants | North America | 98.2 /100 | #114 | Exceptional 2.2% |
| Immigrants | Barbados | 98.2 /100 | #115 | Exceptional 2.2% |