Immigrants from England vs Immigrants from Netherlands Single Father Households
COMPARE
Immigrants from England
Immigrants from Netherlands
Single Father Households
Single Father Households Comparison
Immigrants from England
Immigrants from Netherlands
2.2%
SINGLE FATHER HOUSEHOLDS
96.8/ 100
METRIC RATING
128th/ 347
METRIC RANK
2.2%
SINGLE FATHER HOUSEHOLDS
98.5/ 100
METRIC RATING
108th/ 347
METRIC RANK
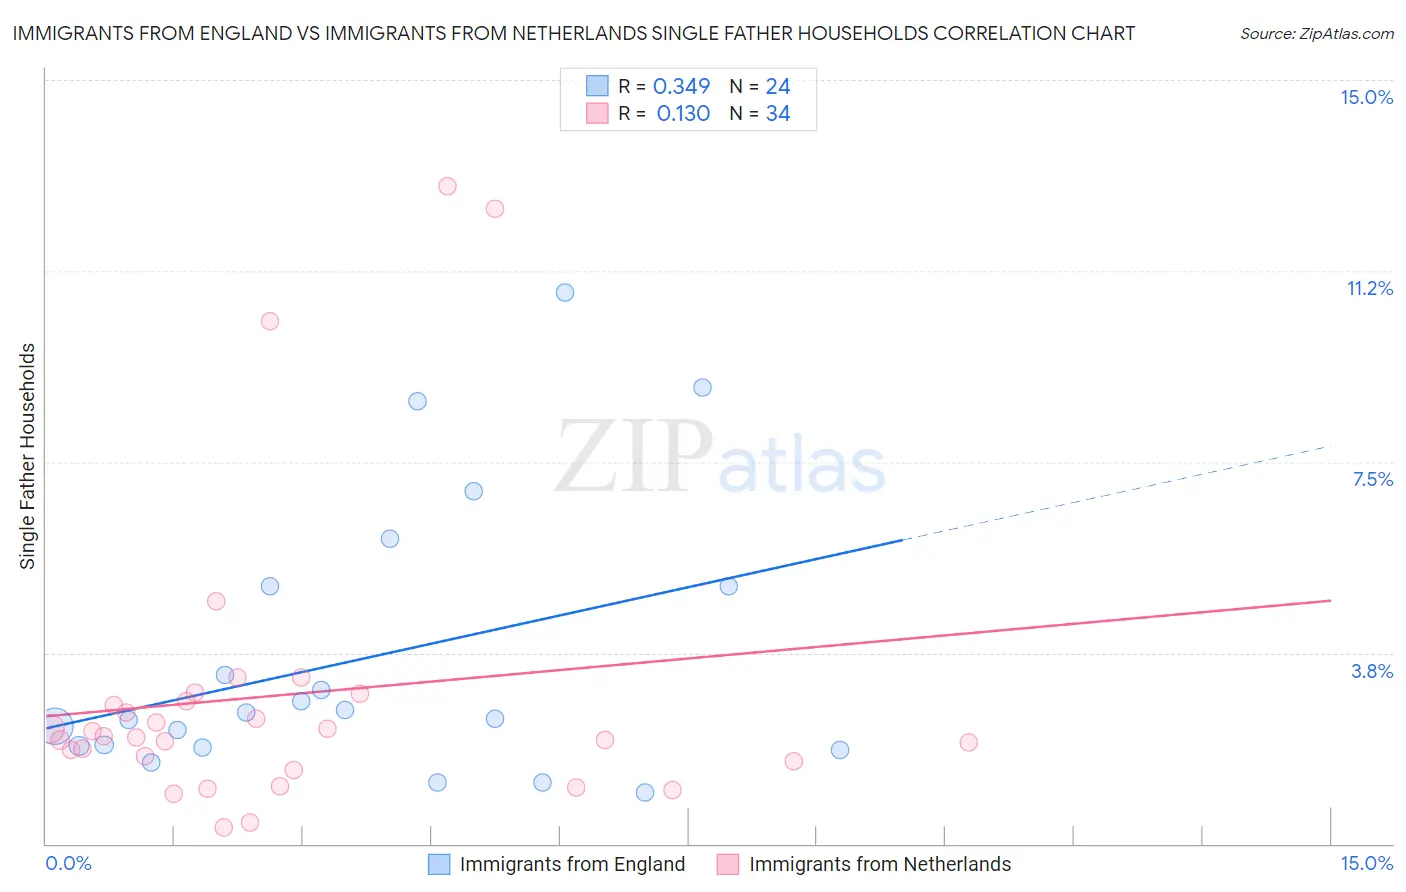
Immigrants from England vs Immigrants from Netherlands Single Father Households Correlation Chart
The statistical analysis conducted on geographies consisting of 387,838,921 people shows a mild positive correlation between the proportion of Immigrants from England and percentage of single father households in the United States with a correlation coefficient (R) of 0.349 and weighted average of 2.2%. Similarly, the statistical analysis conducted on geographies consisting of 236,298,420 people shows a poor positive correlation between the proportion of Immigrants from Netherlands and percentage of single father households in the United States with a correlation coefficient (R) of 0.130 and weighted average of 2.2%, a difference of 1.5%.
Single Father Households Correlation Summary
| Measurement | Immigrants from England | Immigrants from Netherlands |
| Minimum | 1.0% | 0.33% |
| Maximum | 10.8% | 12.9% |
| Range | 9.8% | 12.6% |
| Mean | 3.7% | 2.9% |
| Median | 2.5% | 2.1% |
| Interquartile 25% (IQ1) | 1.9% | 1.6% |
| Interquartile 75% (IQ3) | 5.1% | 2.8% |
| Interquartile Range (IQR) | 3.2% | 1.2% |
| Standard Deviation (Sample) | 2.7% | 3.0% |
| Standard Deviation (Population) | 2.7% | 2.9% |
Demographics Similar to Immigrants from England and Immigrants from Netherlands by Single Father Households
In terms of single father households, the demographic groups most similar to Immigrants from England are Jordanian (2.2%, a difference of 0.040%), Moroccan (2.2%, a difference of 0.050%), Immigrants from Indonesia (2.2%, a difference of 0.36%), British West Indian (2.2%, a difference of 0.41%), and Immigrants from Yemen (2.2%, a difference of 0.43%). Similarly, the demographic groups most similar to Immigrants from Netherlands are Barbadian (2.2%, a difference of 0.040%), Italian (2.2%, a difference of 0.16%), Immigrants from Canada (2.2%, a difference of 0.24%), Immigrants from Trinidad and Tobago (2.2%, a difference of 0.28%), and Iraqi (2.2%, a difference of 0.29%).
| Demographics | Rating | Rank | Single Father Households |
| Immigrants | Netherlands | 98.5 /100 | #108 | Exceptional 2.2% |
| Barbadians | 98.4 /100 | #109 | Exceptional 2.2% |
| Italians | 98.3 /100 | #110 | Exceptional 2.2% |
| Immigrants | Canada | 98.3 /100 | #111 | Exceptional 2.2% |
| Immigrants | Trinidad and Tobago | 98.2 /100 | #112 | Exceptional 2.2% |
| Iraqis | 98.2 /100 | #113 | Exceptional 2.2% |
| Immigrants | North America | 98.2 /100 | #114 | Exceptional 2.2% |
| Immigrants | Barbados | 98.2 /100 | #115 | Exceptional 2.2% |
| Immigrants | Argentina | 98.1 /100 | #116 | Exceptional 2.2% |
| Hungarians | 97.9 /100 | #117 | Exceptional 2.2% |
| Immigrants | Morocco | 97.8 /100 | #118 | Exceptional 2.2% |
| Trinidadians and Tobagonians | 97.8 /100 | #119 | Exceptional 2.2% |
| Australians | 97.7 /100 | #120 | Exceptional 2.2% |
| Immigrants | Brazil | 97.7 /100 | #121 | Exceptional 2.2% |
| Immigrants | Iraq | 97.6 /100 | #122 | Exceptional 2.2% |
| Immigrants | Yemen | 97.5 /100 | #123 | Exceptional 2.2% |
| British West Indians | 97.4 /100 | #124 | Exceptional 2.2% |
| Immigrants | Indonesia | 97.4 /100 | #125 | Exceptional 2.2% |
| Moroccans | 96.9 /100 | #126 | Exceptional 2.2% |
| Jordanians | 96.9 /100 | #127 | Exceptional 2.2% |
| Immigrants | England | 96.8 /100 | #128 | Exceptional 2.2% |