Pueblo vs Immigrants from Netherlands Single Father Households
COMPARE
Pueblo
Immigrants from Netherlands
Single Father Households
Single Father Households Comparison
Pueblo
Immigrants from Netherlands
3.3%
SINGLE FATHER HOUSEHOLDS
0.0/ 100
METRIC RATING
337th/ 347
METRIC RANK
2.2%
SINGLE FATHER HOUSEHOLDS
98.5/ 100
METRIC RATING
108th/ 347
METRIC RANK
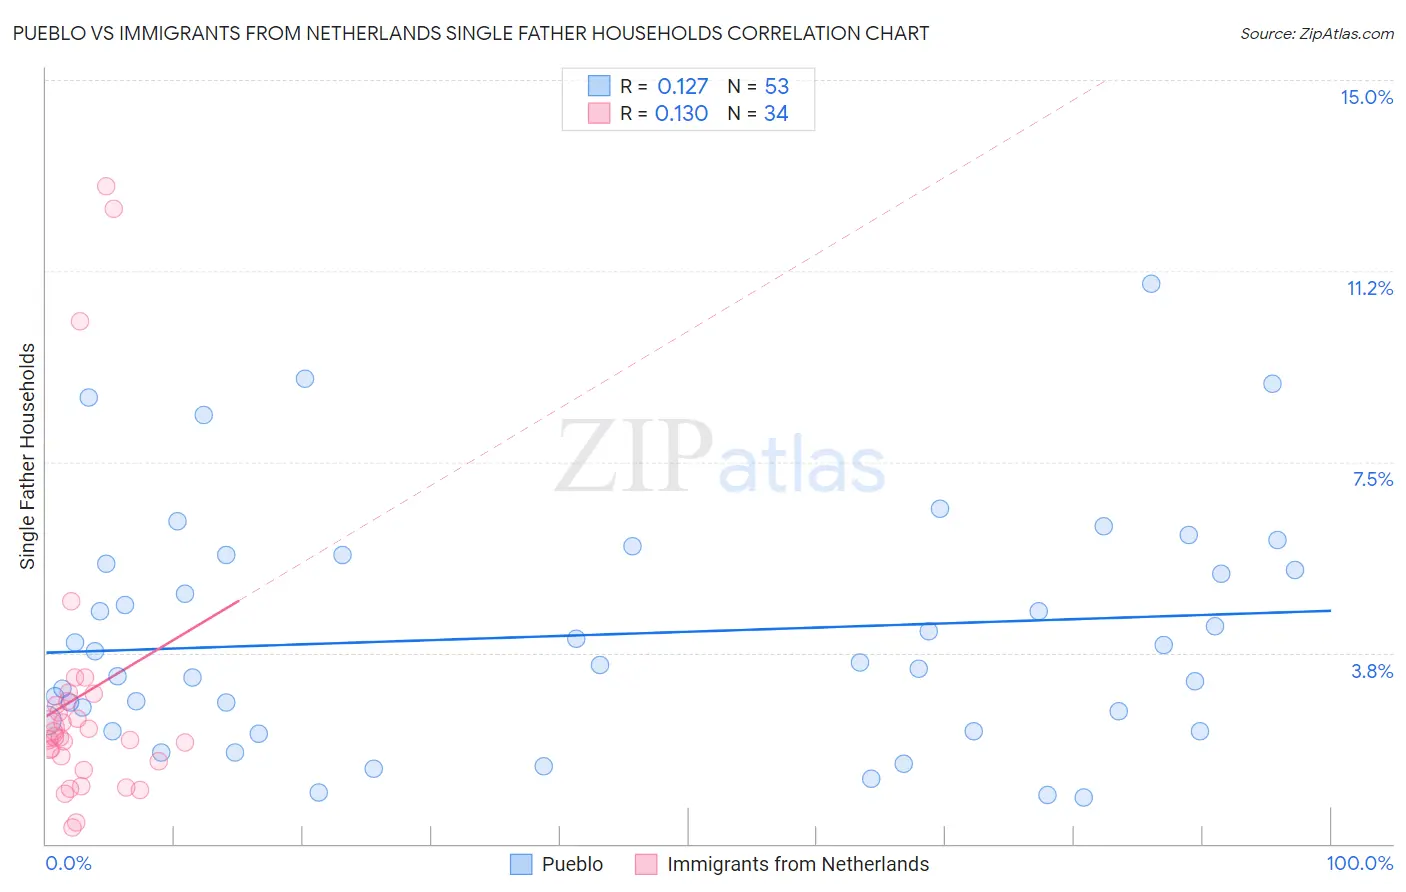
Pueblo vs Immigrants from Netherlands Single Father Households Correlation Chart
The statistical analysis conducted on geographies consisting of 119,775,080 people shows a poor positive correlation between the proportion of Pueblo and percentage of single father households in the United States with a correlation coefficient (R) of 0.127 and weighted average of 3.3%. Similarly, the statistical analysis conducted on geographies consisting of 236,298,420 people shows a poor positive correlation between the proportion of Immigrants from Netherlands and percentage of single father households in the United States with a correlation coefficient (R) of 0.130 and weighted average of 2.2%, a difference of 53.1%.
Single Father Households Correlation Summary
| Measurement | Pueblo | Immigrants from Netherlands |
| Minimum | 0.92% | 0.33% |
| Maximum | 11.0% | 12.9% |
| Range | 10.1% | 12.6% |
| Mean | 4.1% | 2.9% |
| Median | 3.6% | 2.1% |
| Interquartile 25% (IQ1) | 2.3% | 1.6% |
| Interquartile 75% (IQ3) | 5.6% | 2.8% |
| Interquartile Range (IQR) | 3.3% | 1.2% |
| Standard Deviation (Sample) | 2.3% | 3.0% |
| Standard Deviation (Population) | 2.3% | 2.9% |
Similar Demographics by Single Father Households
Demographics Similar to Pueblo by Single Father Households
In terms of single father households, the demographic groups most similar to Pueblo are Paiute (3.3%, a difference of 0.26%), Colville (3.3%, a difference of 0.28%), Yuman (3.3%, a difference of 0.30%), Sioux (3.3%, a difference of 0.68%), and Alaskan Athabascan (3.4%, a difference of 2.1%).
| Demographics | Rating | Rank | Single Father Households |
| Nepalese | 0.0 /100 | #330 | Tragic 3.1% |
| Navajo | 0.0 /100 | #331 | Tragic 3.2% |
| Yaqui | 0.0 /100 | #332 | Tragic 3.2% |
| Natives/Alaskans | 0.0 /100 | #333 | Tragic 3.2% |
| Yuman | 0.0 /100 | #334 | Tragic 3.3% |
| Colville | 0.0 /100 | #335 | Tragic 3.3% |
| Paiute | 0.0 /100 | #336 | Tragic 3.3% |
| Pueblo | 0.0 /100 | #337 | Tragic 3.3% |
| Sioux | 0.0 /100 | #338 | Tragic 3.3% |
| Alaskan Athabascans | 0.0 /100 | #339 | Tragic 3.4% |
| Alaska Natives | 0.0 /100 | #340 | Tragic 3.5% |
| Crow | 0.0 /100 | #341 | Tragic 3.5% |
| Tohono O'odham | 0.0 /100 | #342 | Tragic 3.8% |
| Pima | 0.0 /100 | #343 | Tragic 4.2% |
| Yakama | 0.0 /100 | #344 | Tragic 4.2% |
Demographics Similar to Immigrants from Netherlands by Single Father Households
In terms of single father households, the demographic groups most similar to Immigrants from Netherlands are Slovene (2.2%, a difference of 0.020%), Barbadian (2.2%, a difference of 0.040%), Immigrants from Southern Europe (2.2%, a difference of 0.14%), Italian (2.2%, a difference of 0.16%), and Immigrants from Canada (2.2%, a difference of 0.24%).
| Demographics | Rating | Rank | Single Father Households |
| Immigrants | Western Europe | 98.9 /100 | #101 | Exceptional 2.1% |
| Argentineans | 98.9 /100 | #102 | Exceptional 2.1% |
| Lebanese | 98.9 /100 | #103 | Exceptional 2.1% |
| Alsatians | 98.9 /100 | #104 | Exceptional 2.1% |
| Palestinians | 98.6 /100 | #105 | Exceptional 2.2% |
| Immigrants | Southern Europe | 98.6 /100 | #106 | Exceptional 2.2% |
| Slovenes | 98.5 /100 | #107 | Exceptional 2.2% |
| Immigrants | Netherlands | 98.5 /100 | #108 | Exceptional 2.2% |
| Barbadians | 98.4 /100 | #109 | Exceptional 2.2% |
| Italians | 98.3 /100 | #110 | Exceptional 2.2% |
| Immigrants | Canada | 98.3 /100 | #111 | Exceptional 2.2% |
| Immigrants | Trinidad and Tobago | 98.2 /100 | #112 | Exceptional 2.2% |
| Iraqis | 98.2 /100 | #113 | Exceptional 2.2% |
| Immigrants | North America | 98.2 /100 | #114 | Exceptional 2.2% |
| Immigrants | Barbados | 98.2 /100 | #115 | Exceptional 2.2% |