Arab vs Immigrants from Kenya Average Family Size
COMPARE
Arab
Immigrants from Kenya
Average Family Size
Average Family Size Comparison
Arabs
Immigrants from Kenya
3.23
AVERAGE FAMILY SIZE
53.8/ 100
METRIC RATING
170th/ 347
METRIC RANK
3.21
AVERAGE FAMILY SIZE
19.2/ 100
METRIC RATING
200th/ 347
METRIC RANK
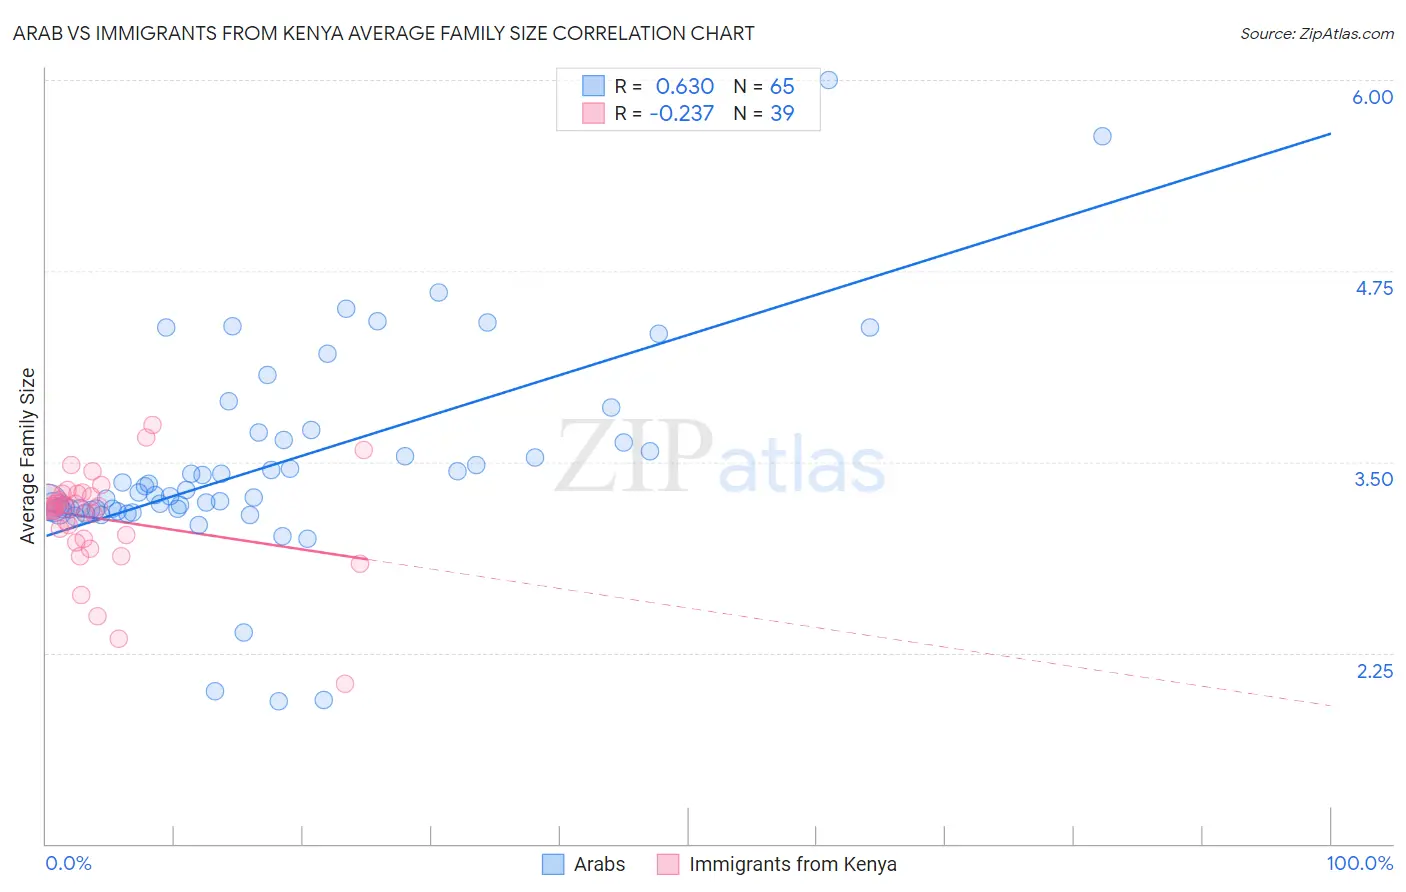
Arab vs Immigrants from Kenya Average Family Size Correlation Chart
The statistical analysis conducted on geographies consisting of 486,389,490 people shows a significant positive correlation between the proportion of Arabs and average family size in the United States with a correlation coefficient (R) of 0.630 and weighted average of 3.23. Similarly, the statistical analysis conducted on geographies consisting of 217,999,239 people shows a weak negative correlation between the proportion of Immigrants from Kenya and average family size in the United States with a correlation coefficient (R) of -0.237 and weighted average of 3.21, a difference of 0.73%.
Average Family Size Correlation Summary
| Measurement | Arab | Immigrants from Kenya |
| Minimum | 1.93 | 2.05 |
| Maximum | 6.00 | 3.74 |
| Range | 4.07 | 1.69 |
| Mean | 3.49 | 3.13 |
| Median | 3.30 | 3.21 |
| Interquartile 25% (IQ1) | 3.19 | 3.00 |
| Interquartile 75% (IQ3) | 3.67 | 3.29 |
| Interquartile Range (IQR) | 0.48 | 0.29 |
| Standard Deviation (Sample) | 0.69 | 0.33 |
| Standard Deviation (Population) | 0.68 | 0.33 |
Similar Demographics by Average Family Size
Demographics Similar to Arabs by Average Family Size
In terms of average family size, the demographic groups most similar to Arabs are Taiwanese (3.23, a difference of 0.010%), Aleut (3.23, a difference of 0.010%), Chilean (3.23, a difference of 0.010%), Immigrants from Congo (3.23, a difference of 0.020%), and Immigrants from Uruguay (3.23, a difference of 0.030%).
| Demographics | Rating | Rank | Average Family Size |
| Uruguayans | 58.8 /100 | #163 | Average 3.23 |
| Egyptians | 58.6 /100 | #164 | Average 3.23 |
| Ugandans | 58.4 /100 | #165 | Average 3.23 |
| Immigrants | Senegal | 57.5 /100 | #166 | Average 3.23 |
| Dutch West Indians | 56.9 /100 | #167 | Average 3.23 |
| Taiwanese | 54.2 /100 | #168 | Average 3.23 |
| Aleuts | 54.1 /100 | #169 | Average 3.23 |
| Arabs | 53.8 /100 | #170 | Average 3.23 |
| Chileans | 53.2 /100 | #171 | Average 3.23 |
| Immigrants | Congo | 52.7 /100 | #172 | Average 3.23 |
| Immigrants | Uruguay | 52.0 /100 | #173 | Average 3.23 |
| Immigrants | South Central Asia | 50.0 /100 | #174 | Average 3.23 |
| Immigrants | China | 49.9 /100 | #175 | Average 3.23 |
| Israelis | 48.7 /100 | #176 | Average 3.23 |
| Argentineans | 47.4 /100 | #177 | Average 3.23 |
Demographics Similar to Immigrants from Kenya by Average Family Size
In terms of average family size, the demographic groups most similar to Immigrants from Kenya are Immigrants from Morocco (3.21, a difference of 0.020%), Immigrants from India (3.21, a difference of 0.020%), Immigrants from Nepal (3.21, a difference of 0.030%), Hmong (3.21, a difference of 0.040%), and Immigrants from the Azores (3.21, a difference of 0.070%).
| Demographics | Rating | Rank | Average Family Size |
| Immigrants | Israel | 29.3 /100 | #193 | Fair 3.22 |
| Immigrants | Sudan | 29.1 /100 | #194 | Fair 3.22 |
| Choctaw | 28.3 /100 | #195 | Fair 3.21 |
| Senegalese | 28.2 /100 | #196 | Fair 3.21 |
| Kenyans | 28.0 /100 | #197 | Fair 3.21 |
| Immigrants | Azores | 21.7 /100 | #198 | Fair 3.21 |
| Hmong | 20.7 /100 | #199 | Fair 3.21 |
| Immigrants | Kenya | 19.2 /100 | #200 | Poor 3.21 |
| Immigrants | Morocco | 18.5 /100 | #201 | Poor 3.21 |
| Immigrants | India | 18.5 /100 | #202 | Poor 3.21 |
| Immigrants | Nepal | 18.1 /100 | #203 | Poor 3.21 |
| Immigrants | Poland | 16.6 /100 | #204 | Poor 3.20 |
| Paraguayans | 16.3 /100 | #205 | Poor 3.20 |
| Immigrants | Cabo Verde | 16.0 /100 | #206 | Poor 3.20 |
| Filipinos | 13.6 /100 | #207 | Poor 3.20 |