Lithuanian vs Immigrants from Kenya Average Family Size
COMPARE
Lithuanian
Immigrants from Kenya
Average Family Size
Average Family Size Comparison
Lithuanians
Immigrants from Kenya
3.10
AVERAGE FAMILY SIZE
0.0/ 100
METRIC RATING
334th/ 347
METRIC RANK
3.21
AVERAGE FAMILY SIZE
19.2/ 100
METRIC RATING
200th/ 347
METRIC RANK
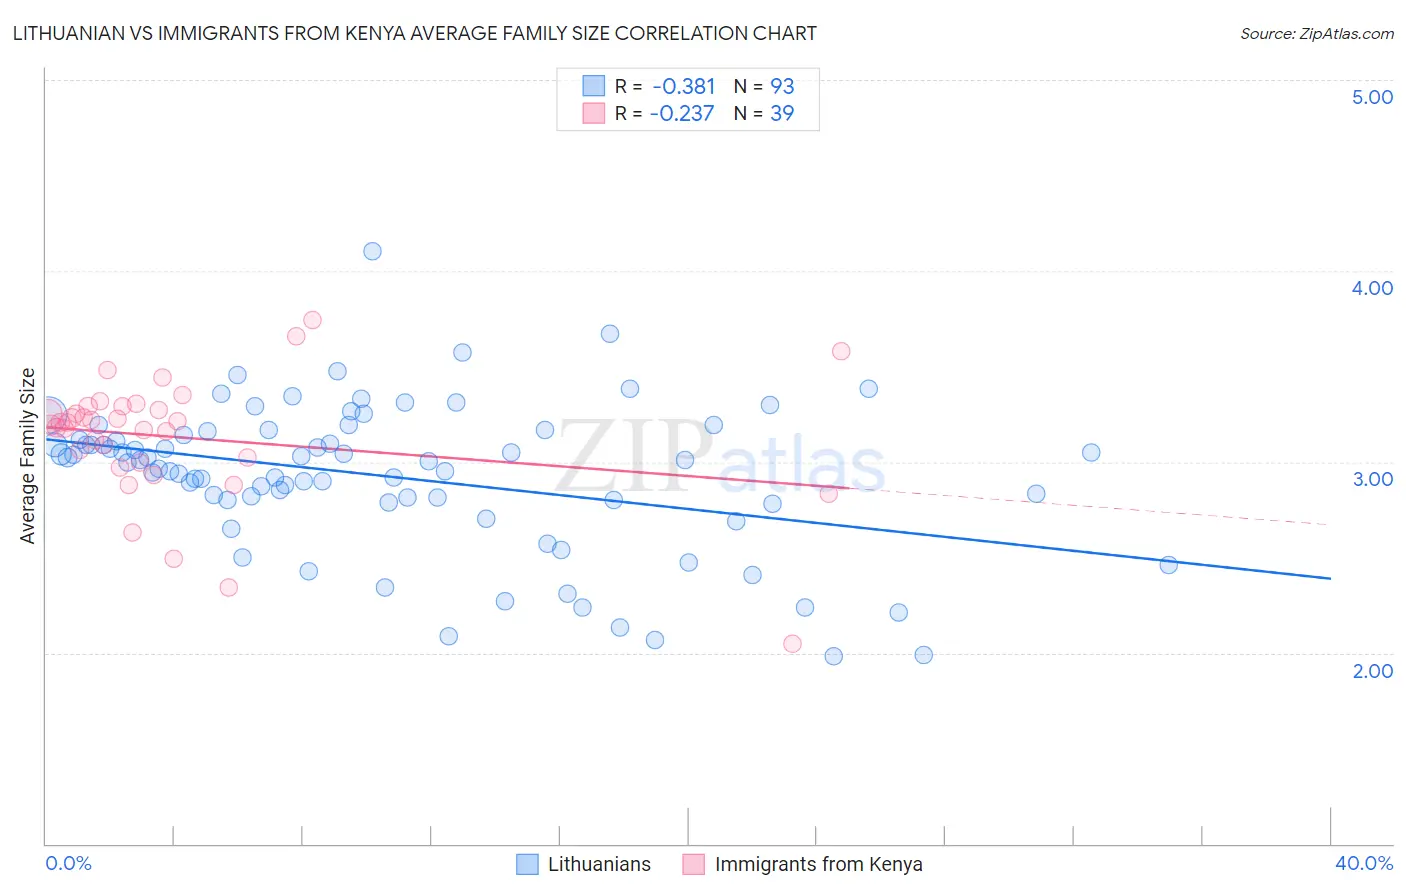
Lithuanian vs Immigrants from Kenya Average Family Size Correlation Chart
The statistical analysis conducted on geographies consisting of 421,743,264 people shows a mild negative correlation between the proportion of Lithuanians and average family size in the United States with a correlation coefficient (R) of -0.381 and weighted average of 3.10. Similarly, the statistical analysis conducted on geographies consisting of 217,999,239 people shows a weak negative correlation between the proportion of Immigrants from Kenya and average family size in the United States with a correlation coefficient (R) of -0.237 and weighted average of 3.21, a difference of 3.3%.
Average Family Size Correlation Summary
| Measurement | Lithuanian | Immigrants from Kenya |
| Minimum | 1.98 | 2.05 |
| Maximum | 4.10 | 3.74 |
| Range | 2.12 | 1.69 |
| Mean | 2.92 | 3.13 |
| Median | 3.00 | 3.21 |
| Interquartile 25% (IQ1) | 2.79 | 3.00 |
| Interquartile 75% (IQ3) | 3.15 | 3.29 |
| Interquartile Range (IQR) | 0.36 | 0.29 |
| Standard Deviation (Sample) | 0.39 | 0.33 |
| Standard Deviation (Population) | 0.38 | 0.33 |
Similar Demographics by Average Family Size
Demographics Similar to Lithuanians by Average Family Size
In terms of average family size, the demographic groups most similar to Lithuanians are Estonian (3.10, a difference of 0.0%), Luxembourger (3.10, a difference of 0.030%), Scotch-Irish (3.11, a difference of 0.050%), Scottish (3.11, a difference of 0.050%), and Latvian (3.11, a difference of 0.060%).
| Demographics | Rating | Rank | Average Family Size |
| Dutch | 0.0 /100 | #327 | Tragic 3.11 |
| Czechs | 0.0 /100 | #328 | Tragic 3.11 |
| Belgians | 0.0 /100 | #329 | Tragic 3.11 |
| Latvians | 0.0 /100 | #330 | Tragic 3.11 |
| Scotch-Irish | 0.0 /100 | #331 | Tragic 3.11 |
| Scottish | 0.0 /100 | #332 | Tragic 3.11 |
| Estonians | 0.0 /100 | #333 | Tragic 3.10 |
| Lithuanians | 0.0 /100 | #334 | Tragic 3.10 |
| Luxembourgers | 0.0 /100 | #335 | Tragic 3.10 |
| Irish | 0.0 /100 | #336 | Tragic 3.10 |
| Swedes | 0.0 /100 | #337 | Tragic 3.10 |
| French | 0.0 /100 | #338 | Tragic 3.10 |
| Croatians | 0.0 /100 | #339 | Tragic 3.10 |
| Finns | 0.0 /100 | #340 | Tragic 3.09 |
| Poles | 0.0 /100 | #341 | Tragic 3.09 |
Demographics Similar to Immigrants from Kenya by Average Family Size
In terms of average family size, the demographic groups most similar to Immigrants from Kenya are Immigrants from Morocco (3.21, a difference of 0.020%), Immigrants from India (3.21, a difference of 0.020%), Immigrants from Nepal (3.21, a difference of 0.030%), Hmong (3.21, a difference of 0.040%), and Immigrants from the Azores (3.21, a difference of 0.070%).
| Demographics | Rating | Rank | Average Family Size |
| Immigrants | Israel | 29.3 /100 | #193 | Fair 3.22 |
| Immigrants | Sudan | 29.1 /100 | #194 | Fair 3.22 |
| Choctaw | 28.3 /100 | #195 | Fair 3.21 |
| Senegalese | 28.2 /100 | #196 | Fair 3.21 |
| Kenyans | 28.0 /100 | #197 | Fair 3.21 |
| Immigrants | Azores | 21.7 /100 | #198 | Fair 3.21 |
| Hmong | 20.7 /100 | #199 | Fair 3.21 |
| Immigrants | Kenya | 19.2 /100 | #200 | Poor 3.21 |
| Immigrants | Morocco | 18.5 /100 | #201 | Poor 3.21 |
| Immigrants | India | 18.5 /100 | #202 | Poor 3.21 |
| Immigrants | Nepal | 18.1 /100 | #203 | Poor 3.21 |
| Immigrants | Poland | 16.6 /100 | #204 | Poor 3.20 |
| Paraguayans | 16.3 /100 | #205 | Poor 3.20 |
| Immigrants | Cabo Verde | 16.0 /100 | #206 | Poor 3.20 |
| Filipinos | 13.6 /100 | #207 | Poor 3.20 |