Immigrants from Italy vs Immigrants from Kenya Average Family Size
COMPARE
Immigrants from Italy
Immigrants from Kenya
Average Family Size
Average Family Size Comparison
Immigrants from Italy
Immigrants from Kenya
3.19
AVERAGE FAMILY SIZE
5.3/ 100
METRIC RATING
229th/ 347
METRIC RANK
3.21
AVERAGE FAMILY SIZE
19.2/ 100
METRIC RATING
200th/ 347
METRIC RANK
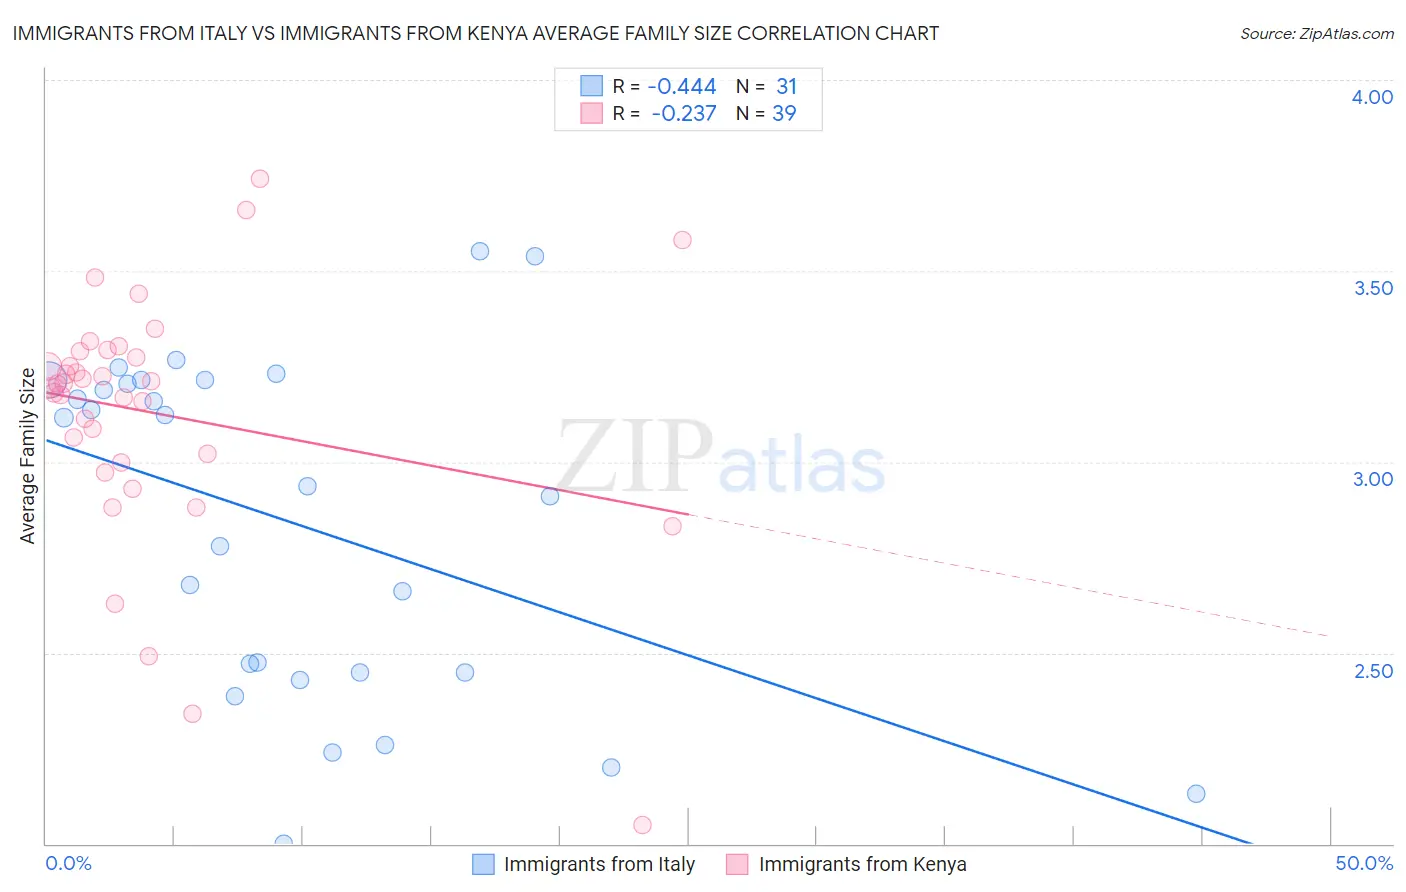
Immigrants from Italy vs Immigrants from Kenya Average Family Size Correlation Chart
The statistical analysis conducted on geographies consisting of 324,146,965 people shows a moderate negative correlation between the proportion of Immigrants from Italy and average family size in the United States with a correlation coefficient (R) of -0.444 and weighted average of 3.19. Similarly, the statistical analysis conducted on geographies consisting of 217,999,239 people shows a weak negative correlation between the proportion of Immigrants from Kenya and average family size in the United States with a correlation coefficient (R) of -0.237 and weighted average of 3.21, a difference of 0.67%.
Average Family Size Correlation Summary
| Measurement | Immigrants from Italy | Immigrants from Kenya |
| Minimum | 2.00 | 2.05 |
| Maximum | 3.55 | 3.74 |
| Range | 1.55 | 1.69 |
| Mean | 2.84 | 3.13 |
| Median | 2.93 | 3.21 |
| Interquartile 25% (IQ1) | 2.45 | 3.00 |
| Interquartile 75% (IQ3) | 3.21 | 3.29 |
| Interquartile Range (IQR) | 0.76 | 0.29 |
| Standard Deviation (Sample) | 0.45 | 0.33 |
| Standard Deviation (Population) | 0.44 | 0.33 |
Similar Demographics by Average Family Size
Demographics Similar to Immigrants from Italy by Average Family Size
In terms of average family size, the demographic groups most similar to Immigrants from Italy are Icelander (3.19, a difference of 0.010%), Basque (3.19, a difference of 0.010%), Nonimmigrants (3.19, a difference of 0.040%), Chickasaw (3.19, a difference of 0.060%), and Portuguese (3.19, a difference of 0.060%).
| Demographics | Rating | Rank | Average Family Size |
| Immigrants | Kuwait | 7.2 /100 | #222 | Tragic 3.19 |
| Immigrants | Zimbabwe | 7.1 /100 | #223 | Tragic 3.19 |
| Syrians | 6.5 /100 | #224 | Tragic 3.19 |
| Cree | 6.2 /100 | #225 | Tragic 3.19 |
| Chickasaw | 6.0 /100 | #226 | Tragic 3.19 |
| Portuguese | 6.0 /100 | #227 | Tragic 3.19 |
| Immigrants | Nonimmigrants | 5.7 /100 | #228 | Tragic 3.19 |
| Immigrants | Italy | 5.3 /100 | #229 | Tragic 3.19 |
| Icelanders | 5.2 /100 | #230 | Tragic 3.19 |
| Basques | 5.2 /100 | #231 | Tragic 3.19 |
| Cherokee | 4.7 /100 | #232 | Tragic 3.18 |
| Brazilians | 4.5 /100 | #233 | Tragic 3.18 |
| Iranians | 4.5 /100 | #234 | Tragic 3.18 |
| Immigrants | Turkey | 4.2 /100 | #235 | Tragic 3.18 |
| Immigrants | Portugal | 4.2 /100 | #236 | Tragic 3.18 |
Demographics Similar to Immigrants from Kenya by Average Family Size
In terms of average family size, the demographic groups most similar to Immigrants from Kenya are Immigrants from Morocco (3.21, a difference of 0.020%), Immigrants from India (3.21, a difference of 0.020%), Immigrants from Nepal (3.21, a difference of 0.030%), Hmong (3.21, a difference of 0.040%), and Immigrants from the Azores (3.21, a difference of 0.070%).
| Demographics | Rating | Rank | Average Family Size |
| Immigrants | Israel | 29.3 /100 | #193 | Fair 3.22 |
| Immigrants | Sudan | 29.1 /100 | #194 | Fair 3.22 |
| Choctaw | 28.3 /100 | #195 | Fair 3.21 |
| Senegalese | 28.2 /100 | #196 | Fair 3.21 |
| Kenyans | 28.0 /100 | #197 | Fair 3.21 |
| Immigrants | Azores | 21.7 /100 | #198 | Fair 3.21 |
| Hmong | 20.7 /100 | #199 | Fair 3.21 |
| Immigrants | Kenya | 19.2 /100 | #200 | Poor 3.21 |
| Immigrants | Morocco | 18.5 /100 | #201 | Poor 3.21 |
| Immigrants | India | 18.5 /100 | #202 | Poor 3.21 |
| Immigrants | Nepal | 18.1 /100 | #203 | Poor 3.21 |
| Immigrants | Poland | 16.6 /100 | #204 | Poor 3.20 |
| Paraguayans | 16.3 /100 | #205 | Poor 3.20 |
| Immigrants | Cabo Verde | 16.0 /100 | #206 | Poor 3.20 |
| Filipinos | 13.6 /100 | #207 | Poor 3.20 |