Immigrants from Eastern Europe vs Immigrants from Kenya Average Family Size

COMPARE

Immigrants from Eastern Europe
Race
Ancestry
AfghanAfricanAlaska NativeAlaskan AthabascanAlbanianAleutAlsatianAmericanApacheArabArapahoArgentineanArmenianAssyrian/Chaldean/SyriacAustralianAustrianBahamianBangladeshiBarbadianBasqueBelgianBelizeanBermudanBhutaneseBlackfeetBolivianBrazilianBritishBritish West IndianBulgarianBurmeseCajunCambodianCanadianCape VerdeanCarpatho RusynCelticCentral AmericanCentral American IndianCherokeeCheyenneChickasawChileanChineseChippewaChoctawColombianColvilleComancheCosta RicanCreeCreekCroatianCrowCubanCypriotCzechCzechoslovakianDanishDelawareDominicanDutchDutch West IndianEastern EuropeanEcuadorianEgyptianEnglishEstonianEthiopianEuropeanFijianFilipinoFinnishFrenchFrench American IndianFrench CanadianGermanGerman RussianGhanaianGreekGuamanian/ChamorroGuatemalanGuyaneseHaitianHmongHonduranHopiHoumaHungarianIcelanderIndian (Asian)IndonesianInupiatIranianIraqiIrishIroquoisIsraeliItalianJamaicanJapaneseJordanianKenyanKiowaKoreanLaotianLatvianLebaneseLiberianLithuanianLumbeeLuxembourgerMacedonianMalaysianMalteseMarshalleseMenomineeMexicanMexican American IndianMongolianMoroccanNative HawaiianNavajoNepaleseNew ZealanderNicaraguanNigerianNorthern EuropeanNorwegianOkinawanOsageOttawaPaiutePakistaniPalestinianPanamanianParaguayanPennsylvania GermanPeruvianPimaPolishPortuguesePotawatomiPuebloPuerto RicanPuget Sound SalishRomanianRussianSalvadoranSamoanScandinavianScotch-IrishScottishSeminoleSenegaleseSerbianShoshoneSierra LeoneanSiouxSlavicSlovakSloveneSomaliSouth AfricanSouth AmericanSouth American IndianSoviet UnionSpaniardSpanishSpanish AmericanSpanish American IndianSri LankanSubsaharan AfricanSudaneseSwedishSwissSyrianTaiwaneseThaiTlingit-HaidaTohono O'OdhamTonganTrinidadian and TobagonianTsimshianTurkishU.S. Virgin IslanderUgandanUkrainianUruguayanUteVenezuelanVietnameseWelshWest IndianYakamaYaquiYugoslavianYumanYup'ikZimbabwean
Immigration
NonimmigrantsImmigrantsAfghanistanAfricaAlbaniaArgentinaArmeniaAsiaAustraliaAustriaBahamasBangladeshBarbadosBelarusBelgiumBelizeBoliviaBosnia and HerzegovinaBrazilBulgariaBurma/MyanmarCabo VerdeCambodiaCameroonCanadaCaribbeanCentral AmericaChileChinaColombiaCongoCosta RicaCroatiaCubaCzechoslovakiaDenmarkDominicaDominican RepublicEastern AfricaEastern AsiaEastern EuropeEcuadorEgyptEl SalvadorEnglandEritreaEthiopiaEuropeFijiFranceGermanyGhanaGreeceGrenadaGuatemalaGuyanaHaitiHondurasHong KongHungaryIndiaIndonesiaIranIraqIrelandIsraelItalyJamaicaJapanJordanKazakhstanKoreaKuwaitLaosLatin AmericaLatviaLebanonLiberiaLithuaniaMalaysiaMexicoMicronesiaMiddle AfricaMoldovaMoroccoNepalNetherlandsNicaraguaNigeriaNorth AmericaNorth MacedoniaNorthern AfricaNorthern EuropeNorwayOceaniaPakistanPanamaPeruPhilippinesPolandPortugalRomaniaRussiaSaudi ArabiaScotlandSenegalSerbiaSierra LeoneSingaporeSomaliaSouth AfricaSouth AmericaSouth Central AsiaSouth Eastern AsiaSouthern EuropeSpainSri LankaSt. Vincent and the GrenadinesSudanSwedenSwitzerlandSyriaTaiwanThailandTrinidad and TobagoTurkeyUgandaUkraineUruguayUzbekistanVenezuelaVietnamWest IndiesWestern AfricaWestern AsiaWestern EuropeYemenZaireZimbabweAzores
Immigrants from Kenya
Race
Ancestry
AfghanAfricanAlaska NativeAlaskan AthabascanAlbanianAleutAlsatianAmericanApacheArabArapahoArgentineanArmenianAssyrian/Chaldean/SyriacAustralianAustrianBahamianBangladeshiBarbadianBasqueBelgianBelizeanBermudanBhutaneseBlackfeetBolivianBrazilianBritishBritish West IndianBulgarianBurmeseCajunCambodianCanadianCape VerdeanCarpatho RusynCelticCentral AmericanCentral American IndianCherokeeCheyenneChickasawChileanChineseChippewaChoctawColombianColvilleComancheCosta RicanCreeCreekCroatianCrowCubanCypriotCzechCzechoslovakianDanishDelawareDominicanDutchDutch West IndianEastern EuropeanEcuadorianEgyptianEnglishEstonianEthiopianEuropeanFijianFilipinoFinnishFrenchFrench American IndianFrench CanadianGermanGerman RussianGhanaianGreekGuamanian/ChamorroGuatemalanGuyaneseHaitianHmongHonduranHopiHoumaHungarianIcelanderIndian (Asian)IndonesianInupiatIranianIraqiIrishIroquoisIsraeliItalianJamaicanJapaneseJordanianKenyanKiowaKoreanLaotianLatvianLebaneseLiberianLithuanianLumbeeLuxembourgerMacedonianMalaysianMalteseMarshalleseMenomineeMexicanMexican American IndianMongolianMoroccanNative HawaiianNavajoNepaleseNew ZealanderNicaraguanNigerianNorthern EuropeanNorwegianOkinawanOsageOttawaPaiutePakistaniPalestinianPanamanianParaguayanPennsylvania GermanPeruvianPimaPolishPortuguesePotawatomiPuebloPuerto RicanPuget Sound SalishRomanianRussianSalvadoranSamoanScandinavianScotch-IrishScottishSeminoleSenegaleseSerbianShoshoneSierra LeoneanSiouxSlavicSlovakSloveneSomaliSouth AfricanSouth AmericanSouth American IndianSoviet UnionSpaniardSpanishSpanish AmericanSpanish American IndianSri LankanSubsaharan AfricanSudaneseSwedishSwissSyrianTaiwaneseThaiTlingit-HaidaTohono O'OdhamTonganTrinidadian and TobagonianTsimshianTurkishU.S. Virgin IslanderUgandanUkrainianUruguayanUteVenezuelanVietnameseWelshWest IndianYakamaYaquiYugoslavianYumanYup'ikZimbabwean
Immigration
NonimmigrantsImmigrantsAfghanistanAfricaAlbaniaArgentinaArmeniaAsiaAustraliaAustriaBahamasBangladeshBarbadosBelarusBelgiumBelizeBoliviaBosnia and HerzegovinaBrazilBulgariaBurma/MyanmarCabo VerdeCambodiaCameroonCanadaCaribbeanCentral AmericaChileChinaColombiaCongoCosta RicaCroatiaCubaCzechoslovakiaDenmarkDominicaDominican RepublicEastern AfricaEastern AsiaEcuadorEgyptEl SalvadorEnglandEritreaEthiopiaEuropeFijiFranceGermanyGhanaGreeceGrenadaGuatemalaGuyanaHaitiHondurasHong KongHungaryIndiaIndonesiaIranIraqIrelandIsraelItalyJamaicaJapanJordanKazakhstanKenyaKoreaKuwaitLaosLatin AmericaLatviaLebanonLiberiaLithuaniaMalaysiaMexicoMicronesiaMiddle AfricaMoldovaMoroccoNepalNetherlandsNicaraguaNigeriaNorth AmericaNorth MacedoniaNorthern AfricaNorthern EuropeNorwayOceaniaPakistanPanamaPeruPhilippinesPolandPortugalRomaniaRussiaSaudi ArabiaScotlandSenegalSerbiaSierra LeoneSingaporeSomaliaSouth AfricaSouth AmericaSouth Central AsiaSouth Eastern AsiaSouthern EuropeSpainSri LankaSt. Vincent and the GrenadinesSudanSwedenSwitzerlandSyriaTaiwanThailandTrinidad and TobagoTurkeyUgandaUkraineUruguayUzbekistanVenezuelaVietnamWest IndiesWestern AfricaWestern AsiaWestern EuropeYemenZaireZimbabweAzores
Average Family Size
Income
Poverty
Unemployment
Labor Participation
Family Structure
Vehicle Availability
Education Level
Disability

Average Family Size Comparison

Immigrants from Eastern Europe

Immigrants from Kenya

Tragic
Poor
3.17
AVERAGE FAMILY SIZE
2.1/ 100
METRIC RATING
249th/ 347
METRIC RANK
3.21
AVERAGE FAMILY SIZE
19.2/ 100
METRIC RATING
200th/ 347
METRIC RANK

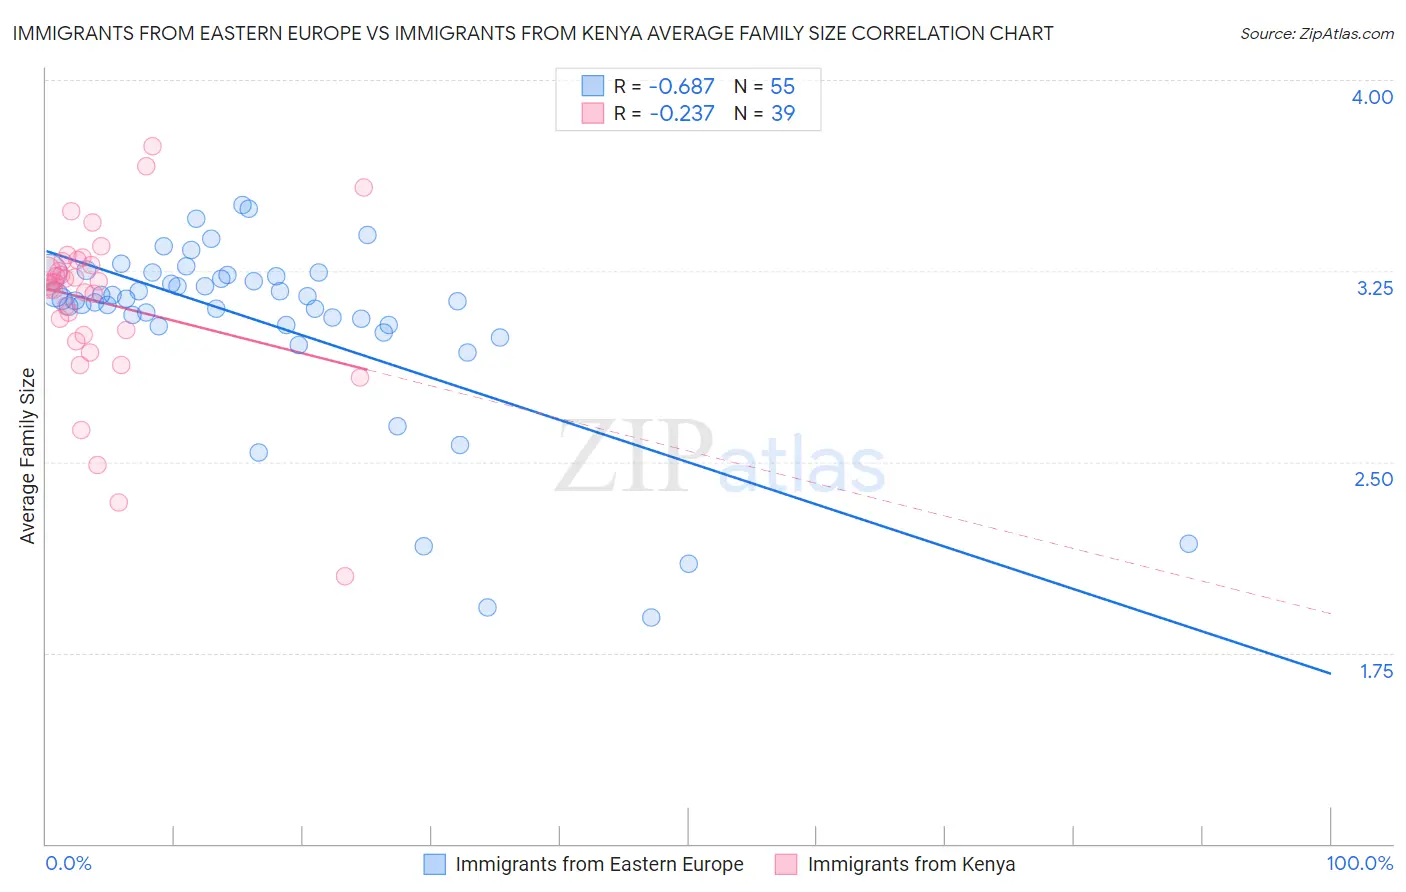
Immigrants from Eastern Europe vs Immigrants from Kenya Average Family Size Correlation Chart

The statistical analysis conducted on geographies consisting of 475,514,082 people shows a significant negative correlation between the proportion of Immigrants from Eastern Europe and average family size in the United States with a correlation coefficient (R) of -0.687 and weighted average of 3.17. Similarly, the statistical analysis conducted on geographies consisting of 217,999,239 people shows a weak negative correlation between the proportion of Immigrants from Kenya and average family size in the United States with a correlation coefficient (R) of -0.237 and weighted average of 3.21, a difference of 1.1%.
Immigrants from Eastern Europe vs Immigrants from Kenya Average Family Size

Average Family Size Correlation Summary

MeasurementImmigrants from Eastern EuropeImmigrants from Kenya
Minimum1.892.05
Maximum3.513.74
Range1.621.69
Mean3.043.13
Median3.143.21
Interquartile 25% (IQ1)3.043.00
Interquartile 75% (IQ3)3.233.29
Interquartile Range (IQR)0.190.29
Standard Deviation (Sample)0.370.33
Standard Deviation (Population)0.360.33

Similar Demographics by Average Family Size

Demographics Similar to Immigrants from Eastern Europe by Average Family Size

In terms of average family size, the demographic groups most similar to Immigrants from Eastern Europe are Immigrants from Belarus (3.17, a difference of 0.040%), Puget Sound Salish (3.17, a difference of 0.060%), Cajun (3.17, a difference of 0.070%), Immigrants from Spain (3.17, a difference of 0.070%), and Danish (3.17, a difference of 0.080%).
DemographicsRating | RankAverage Family Size
Hungarians
3.0
/100
|
#242
Tragic
3.18
Immigrants | Moldova
2.9
/100
|
#243
Tragic
3.18
Immigrants | Southern Europe
2.9
/100
|
#244
Tragic
3.18
Immigrants | Brazil
2.7
/100
|
#245
Tragic
3.18
Danes
2.5
/100
|
#246
Tragic
3.17
Cajuns
2.4
/100
|
#247
Tragic
3.17
Immigrants | Belarus
2.3
/100
|
#248
Tragic
3.17
Immigrants | Eastern Europe
2.1
/100
|
#249
Tragic
3.17
Puget Sound Salish
1.9
/100
|
#250
Tragic
3.17
Immigrants | Spain
1.8
/100
|
#251
Tragic
3.17
Immigrants | Saudi Arabia
1.7
/100
|
#252
Tragic
3.17
South Africans
1.7
/100
|
#253
Tragic
3.17
Immigrants | Hungary
1.7
/100
|
#254
Tragic
3.17
Cape Verdeans
1.6
/100
|
#255
Tragic
3.17
Immigrants | Kazakhstan
1.5
/100
|
#256
Tragic
3.17

Demographics Similar to Immigrants from Kenya by Average Family Size

In terms of average family size, the demographic groups most similar to Immigrants from Kenya are Immigrants from Morocco (3.21, a difference of 0.020%), Immigrants from India (3.21, a difference of 0.020%), Immigrants from Nepal (3.21, a difference of 0.030%), Hmong (3.21, a difference of 0.040%), and Immigrants from the Azores (3.21, a difference of 0.070%).
DemographicsRating | RankAverage Family Size
Immigrants | Israel
29.3
/100
|
#193
Fair
3.22
Immigrants | Sudan
29.1
/100
|
#194
Fair
3.22
Choctaw
28.3
/100
|
#195
Fair
3.21
Senegalese
28.2
/100
|
#196
Fair
3.21
Kenyans
28.0
/100
|
#197
Fair
3.21
Immigrants | Azores
21.7
/100
|
#198
Fair
3.21
Hmong
20.7
/100
|
#199
Fair
3.21
Immigrants | Kenya
19.2
/100
|
#200
Poor
3.21
Immigrants | Morocco
18.5
/100
|
#201
Poor
3.21
Immigrants | India
18.5
/100
|
#202
Poor
3.21
Immigrants | Nepal
18.1
/100
|
#203
Poor
3.21
Immigrants | Poland
16.6
/100
|
#204
Poor
3.20
Paraguayans
16.3
/100
|
#205
Poor
3.20
Immigrants | Cabo Verde
16.0
/100
|
#206
Poor
3.20
Filipinos
13.6
/100
|
#207
Poor
3.20