Lumbee vs Immigrants from Armenia Average Family Size
COMPARE
Lumbee
Immigrants from Armenia
Average Family Size
Average Family Size Comparison
Lumbee
Immigrants from Armenia
3.32
AVERAGE FAMILY SIZE
99.8/ 100
METRIC RATING
80th/ 347
METRIC RANK
3.35
AVERAGE FAMILY SIZE
100.0/ 100
METRIC RATING
60th/ 347
METRIC RANK
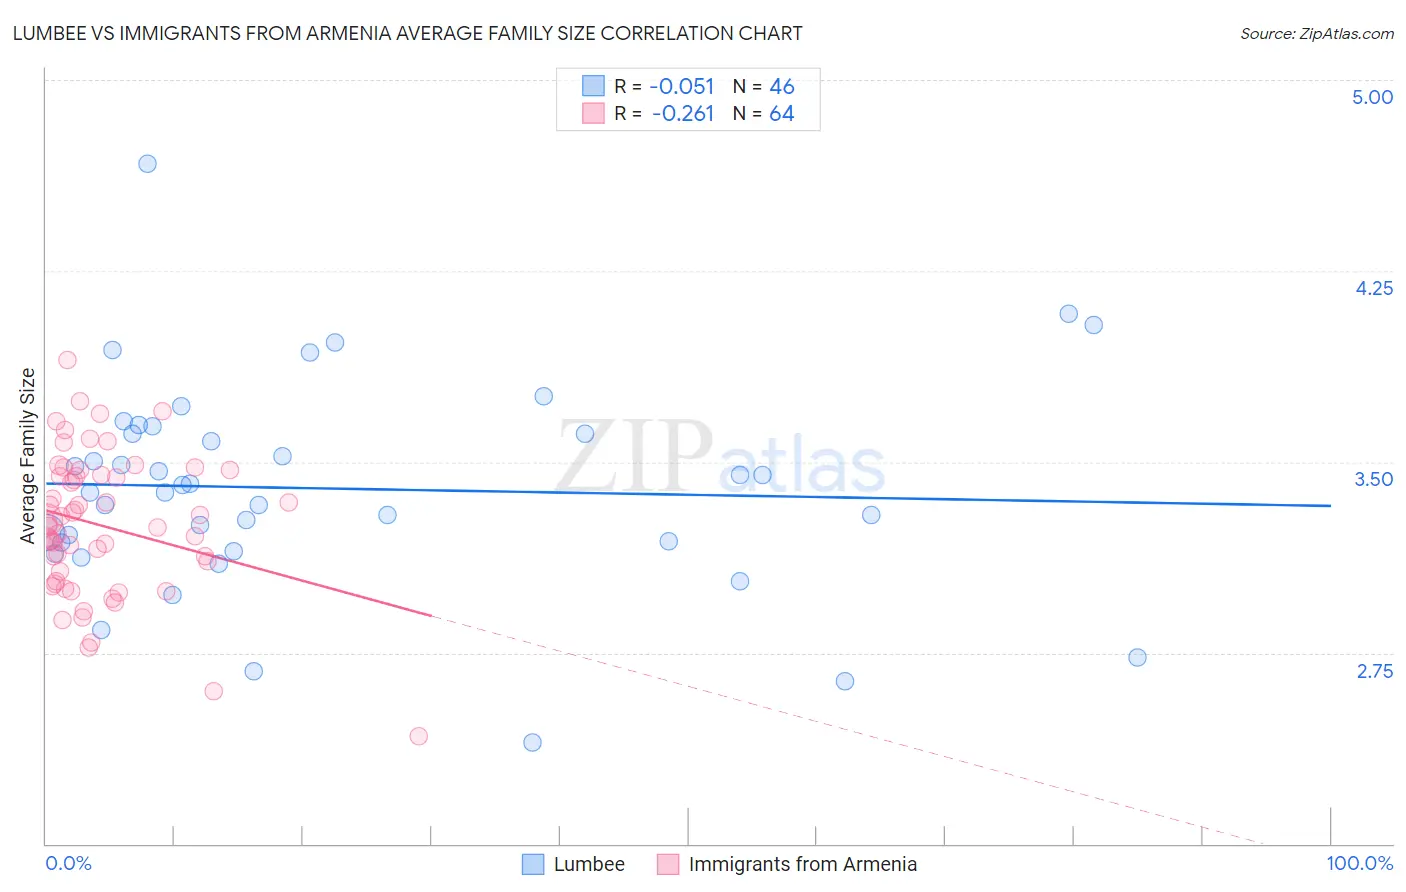
Lumbee vs Immigrants from Armenia Average Family Size Correlation Chart
The statistical analysis conducted on geographies consisting of 92,265,029 people shows a slight negative correlation between the proportion of Lumbee and average family size in the United States with a correlation coefficient (R) of -0.051 and weighted average of 3.32. Similarly, the statistical analysis conducted on geographies consisting of 97,714,180 people shows a weak negative correlation between the proportion of Immigrants from Armenia and average family size in the United States with a correlation coefficient (R) of -0.261 and weighted average of 3.35, a difference of 0.86%.
Average Family Size Correlation Summary
| Measurement | Lumbee | Immigrants from Armenia |
| Minimum | 2.40 | 2.42 |
| Maximum | 4.67 | 3.90 |
| Range | 2.27 | 1.48 |
| Mean | 3.40 | 3.25 |
| Median | 3.40 | 3.25 |
| Interquartile 25% (IQ1) | 3.19 | 3.05 |
| Interquartile 75% (IQ3) | 3.61 | 3.45 |
| Interquartile Range (IQR) | 0.42 | 0.40 |
| Standard Deviation (Sample) | 0.41 | 0.28 |
| Standard Deviation (Population) | 0.41 | 0.28 |
Demographics Similar to Lumbee and Immigrants from Armenia by Average Family Size
In terms of average family size, the demographic groups most similar to Lumbee are British West Indian (3.32, a difference of 0.020%), Immigrants from Micronesia (3.32, a difference of 0.030%), Immigrants from Ecuador (3.32, a difference of 0.070%), Trinidadian and Tobagonian (3.32, a difference of 0.080%), and Immigrants from Barbados (3.32, a difference of 0.10%). Similarly, the demographic groups most similar to Immigrants from Armenia are Central American Indian (3.35, a difference of 0.030%), Immigrants from Grenada (3.34, a difference of 0.21%), Chinese (3.34, a difference of 0.23%), Dominican (3.34, a difference of 0.30%), and Immigrants from Laos (3.34, a difference of 0.32%).
| Demographics | Rating | Rank | Average Family Size |
| Immigrants | Armenia | 100.0 /100 | #60 | Exceptional 3.35 |
| Central American Indians | 100.0 /100 | #61 | Exceptional 3.35 |
| Immigrants | Grenada | 100.0 /100 | #62 | Exceptional 3.34 |
| Chinese | 100.0 /100 | #63 | Exceptional 3.34 |
| Dominicans | 99.9 /100 | #64 | Exceptional 3.34 |
| Immigrants | Laos | 99.9 /100 | #65 | Exceptional 3.34 |
| Immigrants | St. Vincent and the Grenadines | 99.9 /100 | #66 | Exceptional 3.34 |
| Immigrants | Jamaica | 99.9 /100 | #67 | Exceptional 3.33 |
| Immigrants | Cambodia | 99.9 /100 | #68 | Exceptional 3.33 |
| Immigrants | Immigrants | 99.9 /100 | #69 | Exceptional 3.33 |
| Immigrants | Trinidad and Tobago | 99.9 /100 | #70 | Exceptional 3.33 |
| Immigrants | West Indies | 99.9 /100 | #71 | Exceptional 3.33 |
| Immigrants | Caribbean | 99.9 /100 | #72 | Exceptional 3.33 |
| Yaqui | 99.9 /100 | #73 | Exceptional 3.32 |
| Immigrants | Sierra Leone | 99.9 /100 | #74 | Exceptional 3.32 |
| Immigrants | Barbados | 99.8 /100 | #75 | Exceptional 3.32 |
| Trinidadians and Tobagonians | 99.8 /100 | #76 | Exceptional 3.32 |
| Immigrants | Ecuador | 99.8 /100 | #77 | Exceptional 3.32 |
| Immigrants | Micronesia | 99.8 /100 | #78 | Exceptional 3.32 |
| British West Indians | 99.8 /100 | #79 | Exceptional 3.32 |
| Lumbee | 99.8 /100 | #80 | Exceptional 3.32 |