Belgian vs Immigrants from Armenia Average Family Size
COMPARE
Belgian
Immigrants from Armenia
Average Family Size
Average Family Size Comparison
Belgians
Immigrants from Armenia
3.11
AVERAGE FAMILY SIZE
0.0/ 100
METRIC RATING
329th/ 347
METRIC RANK
3.35
AVERAGE FAMILY SIZE
100.0/ 100
METRIC RATING
60th/ 347
METRIC RANK
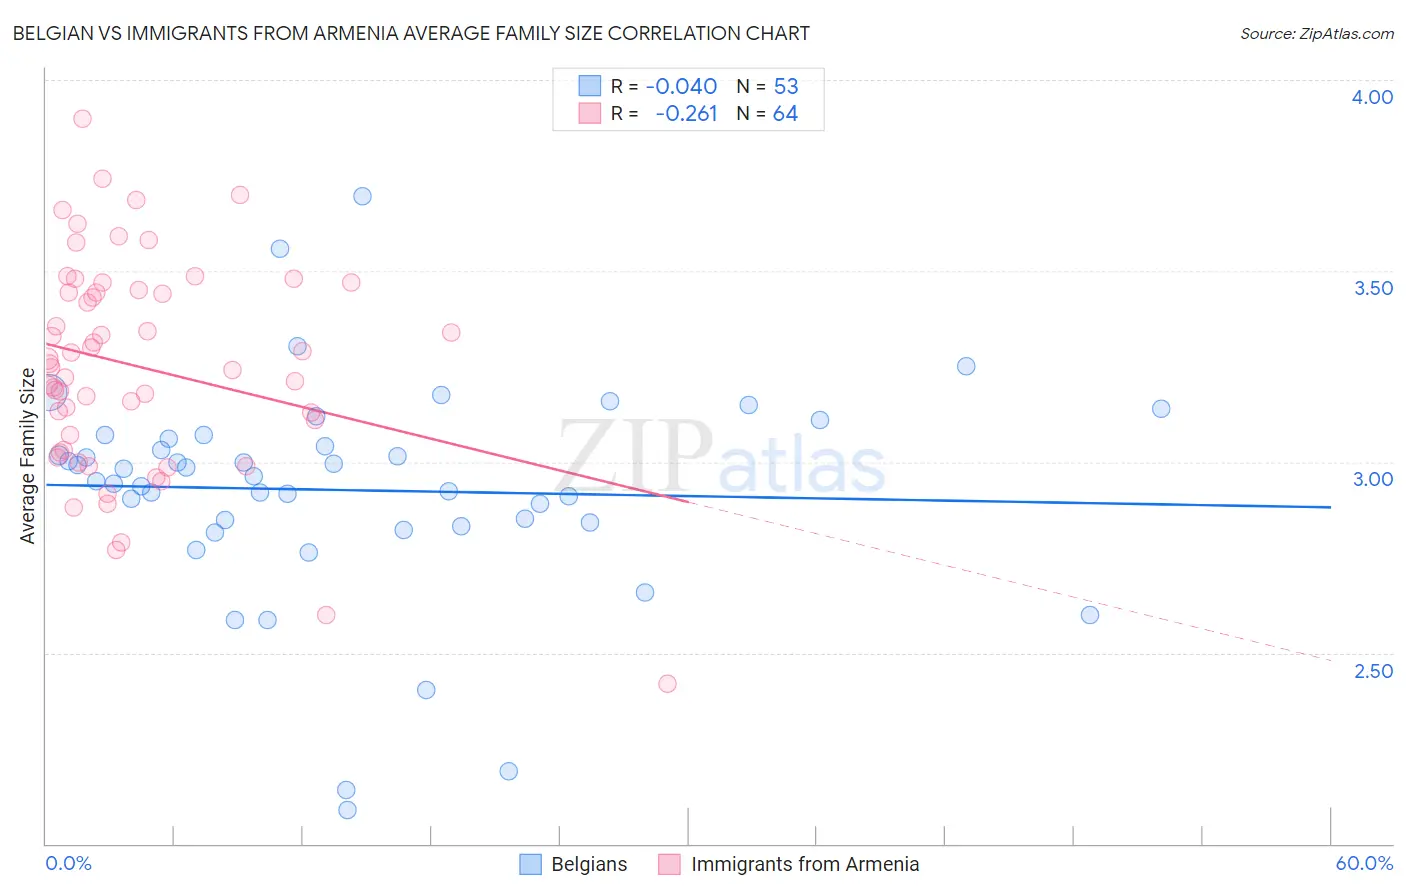
Belgian vs Immigrants from Armenia Average Family Size Correlation Chart
The statistical analysis conducted on geographies consisting of 355,849,592 people shows no correlation between the proportion of Belgians and average family size in the United States with a correlation coefficient (R) of -0.040 and weighted average of 3.11. Similarly, the statistical analysis conducted on geographies consisting of 97,714,180 people shows a weak negative correlation between the proportion of Immigrants from Armenia and average family size in the United States with a correlation coefficient (R) of -0.261 and weighted average of 3.35, a difference of 7.7%.
Average Family Size Correlation Summary
| Measurement | Belgian | Immigrants from Armenia |
| Minimum | 2.09 | 2.42 |
| Maximum | 3.70 | 3.90 |
| Range | 1.61 | 1.48 |
| Mean | 2.93 | 3.25 |
| Median | 2.96 | 3.25 |
| Interquartile 25% (IQ1) | 2.83 | 3.05 |
| Interquartile 75% (IQ3) | 3.07 | 3.45 |
| Interquartile Range (IQR) | 0.23 | 0.40 |
| Standard Deviation (Sample) | 0.29 | 0.28 |
| Standard Deviation (Population) | 0.29 | 0.28 |
Similar Demographics by Average Family Size
Demographics Similar to Belgians by Average Family Size
In terms of average family size, the demographic groups most similar to Belgians are Dutch (3.11, a difference of 0.060%), Czech (3.11, a difference of 0.060%), Latvian (3.11, a difference of 0.060%), Scotch-Irish (3.11, a difference of 0.060%), and Scottish (3.11, a difference of 0.060%).
| Demographics | Rating | Rank | Average Family Size |
| Immigrants | Canada | 0.0 /100 | #322 | Tragic 3.12 |
| Soviet Union | 0.0 /100 | #323 | Tragic 3.11 |
| Celtics | 0.0 /100 | #324 | Tragic 3.11 |
| English | 0.0 /100 | #325 | Tragic 3.11 |
| Ottawa | 0.0 /100 | #326 | Tragic 3.11 |
| Dutch | 0.0 /100 | #327 | Tragic 3.11 |
| Czechs | 0.0 /100 | #328 | Tragic 3.11 |
| Belgians | 0.0 /100 | #329 | Tragic 3.11 |
| Latvians | 0.0 /100 | #330 | Tragic 3.11 |
| Scotch-Irish | 0.0 /100 | #331 | Tragic 3.11 |
| Scottish | 0.0 /100 | #332 | Tragic 3.11 |
| Estonians | 0.0 /100 | #333 | Tragic 3.10 |
| Lithuanians | 0.0 /100 | #334 | Tragic 3.10 |
| Luxembourgers | 0.0 /100 | #335 | Tragic 3.10 |
| Irish | 0.0 /100 | #336 | Tragic 3.10 |
Demographics Similar to Immigrants from Armenia by Average Family Size
In terms of average family size, the demographic groups most similar to Immigrants from Armenia are Japanese (3.35, a difference of 0.020%), Central American Indian (3.35, a difference of 0.030%), Honduran (3.35, a difference of 0.11%), Sri Lankan (3.35, a difference of 0.12%), and Immigrants from Dominican Republic (3.35, a difference of 0.18%).
| Demographics | Rating | Rank | Average Family Size |
| Koreans | 100.0 /100 | #53 | Exceptional 3.36 |
| Immigrants | South Eastern Asia | 100.0 /100 | #54 | Exceptional 3.36 |
| Immigrants | Honduras | 100.0 /100 | #55 | Exceptional 3.36 |
| Immigrants | Dominican Republic | 100.0 /100 | #56 | Exceptional 3.35 |
| Sri Lankans | 100.0 /100 | #57 | Exceptional 3.35 |
| Hondurans | 100.0 /100 | #58 | Exceptional 3.35 |
| Japanese | 100.0 /100 | #59 | Exceptional 3.35 |
| Immigrants | Armenia | 100.0 /100 | #60 | Exceptional 3.35 |
| Central American Indians | 100.0 /100 | #61 | Exceptional 3.35 |
| Immigrants | Grenada | 100.0 /100 | #62 | Exceptional 3.34 |
| Chinese | 100.0 /100 | #63 | Exceptional 3.34 |
| Dominicans | 99.9 /100 | #64 | Exceptional 3.34 |
| Immigrants | Laos | 99.9 /100 | #65 | Exceptional 3.34 |
| Immigrants | St. Vincent and the Grenadines | 99.9 /100 | #66 | Exceptional 3.34 |
| Immigrants | Jamaica | 99.9 /100 | #67 | Exceptional 3.33 |