Immigrants vs Immigrants from Armenia Average Family Size
COMPARE
Immigrants
Immigrants from Armenia
Average Family Size
Average Family Size Comparison
Immigrants
Immigrants from Armenia
3.33
AVERAGE FAMILY SIZE
99.9/ 100
METRIC RATING
69th/ 347
METRIC RANK
3.35
AVERAGE FAMILY SIZE
100.0/ 100
METRIC RATING
60th/ 347
METRIC RANK
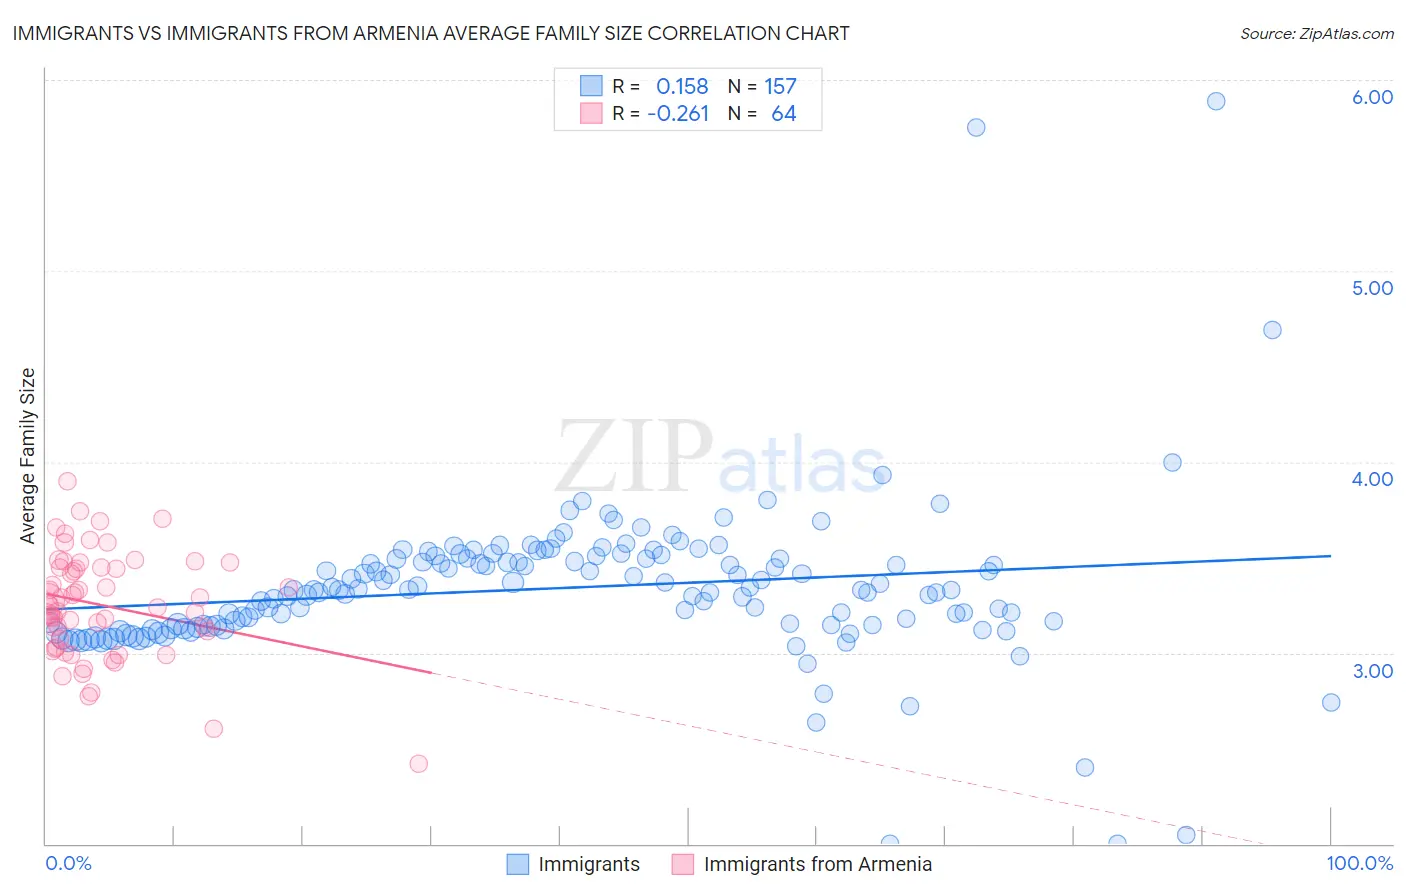
Immigrants vs Immigrants from Armenia Average Family Size Correlation Chart
The statistical analysis conducted on geographies consisting of 577,097,372 people shows a poor positive correlation between the proportion of Immigrants and average family size in the United States with a correlation coefficient (R) of 0.158 and weighted average of 3.33. Similarly, the statistical analysis conducted on geographies consisting of 97,714,180 people shows a weak negative correlation between the proportion of Immigrants from Armenia and average family size in the United States with a correlation coefficient (R) of -0.261 and weighted average of 3.35, a difference of 0.54%.
Average Family Size Correlation Summary
| Measurement | Immigrants | Immigrants from Armenia |
| Minimum | 2.00 | 2.42 |
| Maximum | 5.89 | 3.90 |
| Range | 3.89 | 1.48 |
| Mean | 3.34 | 3.25 |
| Median | 3.33 | 3.25 |
| Interquartile 25% (IQ1) | 3.14 | 3.05 |
| Interquartile 75% (IQ3) | 3.49 | 3.45 |
| Interquartile Range (IQR) | 0.35 | 0.40 |
| Standard Deviation (Sample) | 0.42 | 0.28 |
| Standard Deviation (Population) | 0.42 | 0.28 |
Demographics Similar to Immigrants and Immigrants from Armenia by Average Family Size
In terms of average family size, the demographic groups most similar to Immigrants are Immigrants from Cambodia (3.33, a difference of 0.030%), Immigrants from Trinidad and Tobago (3.33, a difference of 0.050%), Immigrants from West Indies (3.33, a difference of 0.060%), Immigrants from Jamaica (3.33, a difference of 0.11%), and Immigrants from Caribbean (3.33, a difference of 0.13%). Similarly, the demographic groups most similar to Immigrants from Armenia are Japanese (3.35, a difference of 0.020%), Central American Indian (3.35, a difference of 0.030%), Honduran (3.35, a difference of 0.11%), Sri Lankan (3.35, a difference of 0.12%), and Immigrants from Dominican Republic (3.35, a difference of 0.18%).
| Demographics | Rating | Rank | Average Family Size |
| Immigrants | South Eastern Asia | 100.0 /100 | #54 | Exceptional 3.36 |
| Immigrants | Honduras | 100.0 /100 | #55 | Exceptional 3.36 |
| Immigrants | Dominican Republic | 100.0 /100 | #56 | Exceptional 3.35 |
| Sri Lankans | 100.0 /100 | #57 | Exceptional 3.35 |
| Hondurans | 100.0 /100 | #58 | Exceptional 3.35 |
| Japanese | 100.0 /100 | #59 | Exceptional 3.35 |
| Immigrants | Armenia | 100.0 /100 | #60 | Exceptional 3.35 |
| Central American Indians | 100.0 /100 | #61 | Exceptional 3.35 |
| Immigrants | Grenada | 100.0 /100 | #62 | Exceptional 3.34 |
| Chinese | 100.0 /100 | #63 | Exceptional 3.34 |
| Dominicans | 99.9 /100 | #64 | Exceptional 3.34 |
| Immigrants | Laos | 99.9 /100 | #65 | Exceptional 3.34 |
| Immigrants | St. Vincent and the Grenadines | 99.9 /100 | #66 | Exceptional 3.34 |
| Immigrants | Jamaica | 99.9 /100 | #67 | Exceptional 3.33 |
| Immigrants | Cambodia | 99.9 /100 | #68 | Exceptional 3.33 |
| Immigrants | Immigrants | 99.9 /100 | #69 | Exceptional 3.33 |
| Immigrants | Trinidad and Tobago | 99.9 /100 | #70 | Exceptional 3.33 |
| Immigrants | West Indies | 99.9 /100 | #71 | Exceptional 3.33 |
| Immigrants | Caribbean | 99.9 /100 | #72 | Exceptional 3.33 |
| Yaqui | 99.9 /100 | #73 | Exceptional 3.32 |
| Immigrants | Sierra Leone | 99.9 /100 | #74 | Exceptional 3.32 |